Genomic and functional characterization of histone H3 lysine 4 methylation co-localized marks 
Jie Lv
1 
,
Hongbo Liu
1 ,
Hui Liu
1 ,
Qiong Wu
1 
,
Yan Zhang
2
1. School of Life Science and Technology, Harbin Institute of Technology, Harbin, 150001, China
2. College of Bioinformatics Science and Technology, Harbin Medical University, Harbin 150081, China
Author
Correspondence author
Computational Molecular Biology, 2014, Vol. 4, No. 10 doi: 10.5376/cmb.2014.04.0010
Received: 07 Sep., 2014 Accepted: 25 Oct., 2014 Published: 14 Nov., 2014
© 2014 BioPublisher Publishing Platform
This is an open access article published under the terms of the
Creative Commons Attribution License, which permits unrestricted use, distribution, and reproduction in any medium, provided the original work is properly cited.
Preferred citation for this article:
Lv et al., 2014, Genomic and functional characterization of histone H3 lysine 4 methylation co-localized marks, Computational Molecular Biology, Vol.4, No.10, 1-17 (doi: 10.5376/cmb.2014.04.0010)
Abstract
Histone modifications play important roles in dynamic transcription regulation. In mammals, methylation of lysine 4 in histone H3 (H3K4) is associated with open chromatin environment. From functional genomic perspective, the combinations of methylation co-localized marks in lysine residue 4 of histone H3 (H3K4me) are little studied. The genomic patterns of specific H3K4me co-localized peaks are highly conserved. Additionally, the proteins encoded by genes with co-localization peaks in promoter regions have more partners in protein-protein interaction network. We also found the unbalanced base composition, that is, AT nucleotide is preferred in genomic regions with co-localization H3K4me modifications. Gene Ontology enrichment analysis revealed that genes with specific co-localization modifications in promoter regions are function-specific. We also found the PolII level for different combinations are correlated with the differential methyl accumulation of H3K4. Me1me2me3, the triplet for H3K4me, is associated with tissue specificity. This study helps understanding the genomic features of H3K4me co-localization and the role of H3K4me co-localization in function genomic regulation.
Keywords
Histone modifications; Co-localization; Genomic composition; CpG islands; H3K4me
In eukaryote, the chromatin is packed by consecutive octamers comprised by basic histone types H2A, H2B, H3 and H4, around which DNA sequences of 147bp are wrapped. The histones can be altered by different post-translational chemical groups, leading to different biological effects. Acetyl, methyl, phosphoryl and ubiquityl are the most common post-translational chemical group types. Straightforwardly, a common question may be raised by researchers: do different histone modifications bring out distinct biological outcomes? The histone code hypothesis may answer the question (Cosgrove and Wolberger, 2005). According to the hypothesis, specific histone modification combination can act coordinately to form a barcode which is read by other outer proteins to bring about various biological effects. Though the “histone code” hypothesis is debated, arising evidences are emerging to support the hypothesis (Fischle et al., 2003). Histone methylation has been associated with activating and repressive functions. In mouse embryonic stem cells, developmental genes are marked both by the activating H3K4me3 and the repressive H3K27me3 (‘bivalent’) (Mikkelsen et al., 2007; Bernstein et al., 2006; Meissner et al., 2008).
Besides the patterns of different histone modifications at different residues of histones are complex, patterns for different number of methyl groups that modify the same residues are also complex. The ε-amino group of lysines can be mono-, di-, or trimethylated with potentially distinct effects on chromatin structure (Santos-Rosa et al., 2002). In yeast, a H3K4 methyltransferase (SET1) is identified (Liu et al., 2005) and the kinetics of the separation of SET1 from the elongating RNA polymerase is associated with the differential methylation of H3K4. In Arabidopsis thaliana, distinct H3K4 methyltransferase complexes contribute to differential accumulation of H3K4 at specific residues. For example, the dysfunction of H3K4 methyltransferase ATX1 can lead to decreased
H3K4me3 and largely unchanged H3K4me2 (Alvarez-Venegas and Avramova, 2005). In contrast, the dysfunction of H3K4 methyltransferase ATX2 can lead to decreased H3K4me2 and largely unchanged H3K4me3 (Saleh et al., 2008). In the three differential methylation states of H3K4, trimethylation seems to be more stable, while mono- and dimethylation are less stable. JARID1 family includes histone demethylases for H3K4 trimethylation (Agger et al., 2008), and the conversion from H3K4 trimethylation to dimethylation or monomethylation is possible. Mono-, di-, or tri-methyl marks in lysine 4 of histone H3 are key epigenetic modifications for regulating gene expression, especially H3K4me3 mark. In addition, CpG islands (CGIs) enriched with H3K4 methylation are unmethylated to facilitate transcription (Lv et al., 2010a; Zhang et al., 2011; Liu et al., 2013; Su et al., 2012). However, different effects may be associated with mono-, di-, or trimethylation of lysine residues. Mono- and di-methyl marks of H3K4me are enriched in intergenic regions such as enhancers which have indirect regulatory roles on gene expression (Heintzman et al., 2007; Roh et al., 2007). Taken together, significant differences of the function exist for different combinations for H3K4 methylation markers depending on the number of the methyl groups, but little is studied on this issue previously.
Significant technological progress has provided unprecedented resolution for genome-wide histone modification mapping (Barski et al., 2007). Several large-scale studies have provided high-resolution histone modification profiles, the most comprehensive ones are from Barski and Wang et al. in CD4+ T cells (Barski et al., 2007; Wang et al., 2008). Based on this dataset, we aim to study the specific genomic and other attributes for both four methylation co-localized marks in lysine residue 4 of histone H3 (H3K4), that is, mono- and di-methylation (me1me2), mono- and tri-methylation (me1me3), mono-, di- and tri-methylation (me1me2me3), lastly, di- and tri-methylation (me2me3), with single-localized marks for me1, me2 and me3 as controls. Principally, the number of mapped tags detected for a particular position is proportional to the specific modification level of the corresponding nucleosome. The enriched genomic fragments are considered as ‘true’ peaks in genomic scale, either span single nucleosome or multiple nucleosomes.
It is unknown what are the distinctions of underlying genomic features for co-localized and single-localized histone methylation modifications. In this study, we characterize the genomic and functional genomic features for four H3K4me co-localization types. Some but all co-localization combinations are more conserved than single-localization controls at a higher-than-expected frequency in and out of transcriptional start sites (TSSs) proximal regions (TPRs). The proteins encoded by the genes overlapping co-localized peaks in TPRs have more protein partners in protein-protein interaction network than those with single-localized peaks. Moreover, co-localization types are distinct with respect to functional categories revealed by Gene Ontology enrichment analysis, suggesting that genes with similar functions may share similar H3K4me co-localization patterns. CpG depletion is more prominent in co-localization related genes than controls. In addition, AT nucleotide-rich is a general feature for co-localized H3K4 methylation regions. Me1me2me3, the triplet version of H3K4me, is found to be prominently associated with tissue specificity. Overall, this study represents an important contribution to the understanding of histone codes (Lv et al., 2010a) and the role of H3K4me co-localization in function genomic regulation.
1 Methods
1.1 Datasets
The histone modification profile of lysine 4 in histone H3 was from Barski et al. (Barski et al., 2007). It was the most comprehensive genome-scale profiling of histone methylation in human. The histone modification dataset was from human G0/G1 CD4+ T cells. In their studies, ChIP-sequencing (ChIP-seq) was used to sequence tags from two ends of genomic fragments digested from microccocal nuclease (MNase). The technology is quantitative and cost-effective for genome-wide histone modification study. Phylogenetic Conserved Elements (PhastCons) annotation file (hg18), RefSeq gene annotation and reference genomic sequences were downloaded from the UCSC Table Browser (Rhead et al., 2010). The phastCons (pC) score was linearly transformed from [0, 1000] to [0, 1]. If a ChIP-seq peak has no overlap with phast Cons data, the conservation value for that peak is zero.
1.2 Peak finding
The concept of co-localization is based on identified peak in this study. The ChIP-seq peak finding procedure is illustrated as below. A negative binomial model for each modification profile was trained to provide FDR control, for the negative binomial model provides a much better fit to the ChIP-seq data than does the Poisson model. FDRs were estimated by modeling the read count in windows using negative binomial distribution. Each chromosome was scanned with the window size of 100bp with window moving consecutively per 25bp. Under the negative binomial model, windows with read counts greater than a user chosen cutoff for bona fide binding regions were identified by controlling FDR < 0.05.
1.3 Co-localization peak identification
To classify genome-wide peaks into different co-localized groups: me1me2, me1me2me3, me1me3, me2me3 and controls (single-localized peaks), genomic intervals were compared exhaustively. Ten Overlap rate (OR) cutoffs were considered in parallel. OR = 1.0 is the most stringent co-localized peak cutoff, likewise, OR = 0.1 generates the loosest. Most analysis in this study took OR = 0.5 as a basis if no explicit statement was declared.
1.4 Gene overlapping analysis
To assess the functional genomic attributes for peaks, we associated the co-localized and single-localized peaks with TPRs defined by upstream 1k and downstream 2k around TSSs of any annotated genes. The boundaries for TPRs were suggested by the study of Barski et al.
1.5 Gene Ontology enrichment analysis
RefSeq mRNA IDs of co-localized peaks overlapping with annotated genes were submitted to the DAVID system (Huang da et al., 2009). Only GO terms with reported p-values smaller than 10E-3 and met by Bonferroni multiple testing correction cutoffs were extracted.
1.6 Motif analysis
It was interesting to search for enriched sequence patterns for four classes of co-localized peaks overlapping with genes. We used Gibbs Motif Sampler with 3000 iterations powered by cisGenome suite to perform the analysis (Ji et al., 2008). For the generated motifs, only one key motif was considered as the enriched one by performing motif enrichment. To make a fair control, the matched genomic control sequences simulated from corresponding co-localized peak sequences were used. The software configuration was set according to online tutorial.
2 Results
2.1 Genomic element distribution for different localization types
A total of 82,283 peaks were identified by peak detection. When considering the peak percentages in TSS-proximal regions (TPRs, defined by upstream 1k and downstream 2k around TSSs) and non-TPR regions, we find co-localized peaks vary little in the two regions (Supplementary Table 1). Generally, Me1 localizes less in TPRs, while me2 and me3 localize more in TPRs compared with non-TPRs. The number of me2me3 co-localization is the most relative to other co-localization types (6% overall).
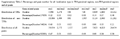
Supplementary Table 1 Percentage and peak number for all localization type in TSS-proximal regions, non-TSS-proximal regions and all peaks
|
Then, co- and single-localized peaks overlapping with gene annotation were identified. The summarized box plot was shown in Figure 1 (A). We noted that exon region was not overrepresented in co-localized peaks, compared to single-localized (control) peaks. With respect to intron region, a significant higher percentage than control group could be observed in me1me2 group, suggesting me1me2 was probably a housekeeping mark for gene body and involved in the transcriptional elongation. For any combinations involving me1, the percentage of overlapping introns was higher than others. In addition, 5′ UTR was depleted in co-localized signals, compared with controls. For 3′ UTR element and TES (0k, 10k), all marks followed similar distributions. Compared with single-localized peaks, me1me2 and me2me3 co-localized peaks in regions of 1k upstream of TSSs were found significantly prominent, while me1me2 and me1me3 co-localized peaks were significantly prominent within (-10k, -1k) upstream of TSSs. We found that the me1 and me2 related co-localized groups distributed more than single-localized group within (1k, 10k) downstream of TES, consistent with the previous observation that me1 and me2 signals tended to distribute towards 3′ regions of genes (Zhang et al., 2009). The re-summarized landscape of i
Computational Molecular Biology
• Volume 4