Fuel Loading and the Potential for Carbon Emissions from Fire Following Two Shelterwood Harvest Treatments in Southern Ohio 
 Author
  Correspondence author
Genomics and Applied Biology, 2010, Vol. 1, No. 1 doi: 10.5376/gab.2010.01.0001
Received: 15 Aug., 2010 Accepted: 09 Sep., 2010 Published: 27 Sep., 2010
Tao and Allen, 2010, Fuel Loading and the potential for carbon emissions from fire following two shelterwood harvest treatments in Southern Ohio, Genomics and Applied Biology ,29(4): 628-638 (DOI: 10.3969/gab.029.000628)
The purpose of this paper is to report the fuel load following shelterwood harvest of two intensities (70% residual stocking and 50% residual stocking), the total carbon content contained in these fuels, and the potential carbon emissions from fire. And the fuel load includes forest litter, woody and herbaceous plants and dead wood. The research results show that the forest litter and the woody plants display significantly greater carbon content than herbaceous plants. The forest litter represents 36.6%, 50.9% and 66.0% of the total fuel load for the 50% treatment, 70% treatment and control respectively. Coarse woody debris accounts for 58.4%, 48.0%and 32.6% of the total fuel load for the 50% treatment, 70% treatment and control respectively. Small woody and herbaceous materials contribute very little to the fuel loading in all treatments. The total fuel loading was determined to be 54.07 t/ha, 41.98 t/ha and 20.73 t/ha for the 50% treatment, 70% treatment, and the control, respectively. If all these fuels were consumed in a wildfire, it is estimated that the total carbon compound emissions from a fire would be 90.39 t/ha, 70.19 t/ha, and 34.66 t/ha, in the same respective order. The harvesting treatments produced more 1~10 hours fuels than the control, although not significantly between them. The 50% treatment and 70% treatment produced 25.08 t/ha and 23.47 t/ha of 1~10 hours fuels, respectively, compared to 14.38 t/ha in the control. A prescribed fire would more likely consume only the fuels in this fuel category, thus emitting 41.93 t/ha, 39.24 t/ha and 23.55 t/ha of carbon compounds from the 50% treatment, 70% treatment, and the control, respectively. This study may be worthwhile to account for the reduction in carbon emissions obtained when prescribed burns are implemented as a fuel reduction strategy in forest carbon offset projects.
Historically fire was a frequent disturbance process that shaped the oak-dominated ecosystems in the Eastern United States. These fires were the result of lightning strikes, Native American use of fire, and later, Euro-American settlers. Oak is well adapted to fire, and in fact requires fire to help maintain a dominant position in regeneration layers (Sutherland and Hutchinson, 2003; van Lear and Watt, 1993). However, fire suppression policies and practices since the 1930's have led to a reduction in oak abundance and sustainability across the eastern landscapes (Lorimer, 1984; 1993; Abrams, 1992; van Lear and Watt, 1993).
In recent years, the use of prescribed fire as a means to maintain or restore oak forests has gained renewed interest as studies have indicated the potential effectiveness of this management tool (Reich et al., 1990; Brose et al., 1999). The abundance of oak regeneration failure throughout its eastern range requires that innovative management techniques must be developed and implemented if forest managers are to sustain oak forests. Prescribed fire is sometimes combined with harvesting systems, such as shelterwood harvests, to further enhance oak regeneration. The shelterwood method of cutting has often been recommended as a technique to promote oak regeneration when it is lacking on productive sites (Sander et al., 1983). However, this method often has failed because the conditions conducive to the development of oak regeneration that this system provides also stimulate intense competition from less desirable species (Loftis, 1983; Sander, 1979; Schuler and Miller, 1995). Combining prescribed fire with shelterwood harvests have produced promising results (Jackson and Buckley, 2004; Brose et al., 1999) as this combined practice takes advantage of the fire tolerance of oak.
Harvesting alters the fuel load in the forest and the subsequent carbon pool contained within the fuel (Barton et al., 1996). Accordingly, this will impact not only how a prescribed fire will burn, but also the carbon emissions that result from burning. Carbon dioxide (CO2) accounts for the largest fraction of emitted carbon from biomass burning, with more than 80% of the carbon consumed by fire oxidized into carbon dioxide (Kasischke et al., 2005). CO2 is unique among gaseous combustion products in which it does not undergo chemical reaction in the atmosphere. Once in the atmosphere, it has an atmospheric lifetime of more than 50 years before being reabsorbed by plants through photosynthesis. Since prescribed fires in eastern hardwood forests typically consume only ground-level vegetation, it is doubtful that their contribution to greenhouse gas (GHG) particulates are significant on a global scale. However, this could change as its use continues to increase.
The national plan for reducing GHG in the United States includes voluntary reporting by entities in the public and private sector (Abraham, 2004). Since forest activities at the national level represent a significant fraction of the potential GHG mitigation activities (Pacala and Socolow, 2004; Caldeira et al., 2004), participation requires estimating and monitoring forest carbon stocks and sequestration rates, including leakages from management systems that result from harvesting and prescribed fire (Birdsey, 2006). The purpose of this paper is to report the fuel load following shelterwood harvests of two intensities, and the total carbon content contained in these fuels. The research will provide necessary information for forest managers regarding how harvest intensity affects fuel loads and the subsequent potential carbon emissions from either prescribed or wild fire after stands are harvested.
1 Results
1.1 Percent Carbon
ANOVA (analysis of variance) performed on the percent carbon revealed that differences existed between fuel components. Duncan's multiple range test was performed on the percent carbon means to determine where significant differences occurred (table 1). The forest litter and woody plants displayed significantly greater carbon content than herbaceous material. Forest litter and woody plants displayed a content close to 50 percent, which is the common factor used for woody plant components when the carbon content is unknown.
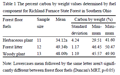 Table 1 The mean fuel loading (t/ha) following harvesting treatments compared to the control by fuel time-lag category in the Richland Furnace State Forest, Southern Ohio |
The appropriate percent carbon values for each fuel component were applied to the estimated biomass values to determine the carbon content. The percent carbon by weight value was not determined for deadwood material. Therefore in this case a value of 0.5 was applied to each decay class once the biomass was determined.
1.2 Fuel Load and Carbon
One year following harvest the 50% stocking treat ment had the highest total fuel loading compared to the 70% treatment and the control (table 2). The 50% treatment contained the greatest amount of coarse woody debris (deadwood) compared to the 70% treatment and the control as a higher amount of deadwood stems >5 cm diameter occurred in this treatment. Accordingly, the higher logging intensity left more coarse woody debris. The 70% treatment contained a large amount of small branches <5 cm diameter in the logging residue as indicated by the higher forest litter component.
 Table 2 The mean residual fuel biomass and total carbon following shelterwood harvests in oak-hickory forests that reduced stocking to 70% and 50% as compared to a control in Richland Furnace State Forest, Southern Ohio |
Herbaceous material contributed very little to the fuel loading in all treatments and the control (table 2). Still, a trend was indicated that a more open canopy plus greater disturbance allowed more herbaceous plants to develop. The greatest amount was found in the 50% treatment, followed by the 70% treatment and the control, respectively. Small woody plants likewise contributed very little to the overall fuel component one year after harvest. No trends were revealed relative to harvest intensity or compared to the control.
Both harvesting treatments created significantly more total fuel than what currently existed in the control (no harvesting). The majority of the fuel was contained in the forest litter and deadwood material. The contribution of deadwood material to the total fuel load decreased as harvesting intensity decreased. Deadwood accounted for 58.4%, 48.0% and 32.6% for the 50% treatment, 70% treatment, and control, respectively. This trend was reversed for forest litter, which represented 36.6%, 50.9% and 67.0% of the total fuel load for the 50% treatment, 70% treatment and the control, respectively.
In terms of tonnage, the less intensive harvesting treatment produced 8% more litter material but 36% less deadwood material than the more intensive harvest treatment (table 2). This may be a reflection of the type of harvesting system used to implement the treatments. A mechanical cut-to-length system was employed, using a knuckle-boom feller-buncher to harvest the trees and a forwarding machine to extract the wood. The less intensive harvest treatment would make maneuverability more difficult and utilization of topwood material more difficult. Accordingly, more small branch material would be left behind as a result of lower utilization and more frequent branch breakage would occur while maneuvering through a more dense forest. Because of lower volumes being extracted from the less intensive harvest, it becomes more imperative to utilize more of the larger material; Thus less of the larger deadwood material would be left behind.
Jenkins and his colleagues (2004) found more residual coarse woody debris following less intensive harvests (group selection) than in more intensive (clear cuts). Their explanation for this observation was the different market forces related to each harvesting systems. Smaller openings created by group selection may not make it economically feasible to utilize as much topwood as it might in a clearcut system due to comparatively low volumes produced in a dispersed harvesting system.
The carbon stored in the fuels follows the similar trends as the fuel loading. Significantly more carbon is stored in fuels after harvests compared to the control, averaging 98%~118% more stored carbon (table 2). The majority of the stored carbon (65.7%) in the unharvested control is contained in the forest litter, whereas the majority of stored carbon in the 50% treatment (59.5%) is contained in the residual deadwood material. The stored carbon in the 70% treatment is evenly distributed in both the forest litter (50.6%) and the deadwood material (48.4%).
Where the carbon is stored is critical when considering fire events. Whether the fire is wild or prescribed, the majority of the fuels consumed would be the forest litter material. A prescribed burn would consume some of the smaller deadwood material, but a wildfire would more than likely consume a larger fraction of this material. Accordingly, one would expect larger carbon emissions from a wildfire compared to a prescribed burn.
2 Discussion
2.1 Percent Carbon
The percent carbon by weight values are consistent with that found by Nicodemus and Williams (2004) for woody components of hardwoods in Ohio (47.52%), and by Koch (1989), where the average carbon content for tree species in the United States was 52.1% for softwoods and 49.1% for hardwoods. Hughes and his colleagues (1999) found percent carbon values for litter and small woody stems (seedlings) to be 45% and 43%, respectively. This compares to 49.34% for litter and 48.09% for small woody stems found in this study.
Many of the studies in the literature use one standard percentage of carbon for tree components. For many the value is 50% (Nowak and Crane, 2002; Brack, 2002; Kimble et al., 2003, Makundi et al., 1995, Dieter and Elsasser, 2002), with one at 45% (Nowak, 1993) and one at 46% (Patenaude et al., 2003). Canary and other colleagues (2000) calculated the values for fir and found a range of 48.1% to 54.6% with an average of 51.2%. All of these values seem to be consistent with the values determined from this study.
The carbon content value for herbaceous plants in this study (34.12%) was significantly less than that of woody plants and forest litter. Hughes and others (1999) found the carbon content of grasses in humid tropical climates to be 41%. If a standard value of 50% of dry plant weight had been used to estimate carbon, it would have been overestimated by 46.5%. While the herbaceous material made up only a small fraction of the total fuel, this overestimation can be quite significant in cases where herbaceous material comprises a larger portion of the total fuel load.
2.2 Fuel Load and Carbon Emissions
The total fuel loading reported from this study for the control (20.73 t/ha) was relatively close to the fuel- loading factor of 19.5 t/ha used by EPA for determination of predicted prescribed fire emissions for this region (Liu, 2004; http://www.epa.gov/ ttnchie1/net/v3announ cement.pdf). It likewise is close to the mean fuel load value of 22.67 t/ha reported by Woodall and his colleagues (2007) for oak-dominated forest ecosystems in the eastern US. It is obvious that harvesting has more than doubled the average fuel load reported for these forest types.
Using emission factors reported by Battye and Battye (2002; http://www.epa.gov/ttn/chief/ap42/ch13/ related/firerept.pdf), if all of this fuel is consumed one might expect the carbon emissions reported in table 3 from a wildfire, assuming average combustion efficiency and fuel moisture. The potential is significantly greater in the harvested areas compared to the control (table 3). It is doubtful that all of this fuel would be totally consumed by a prescribed burn. However, because a higher fuel load tonnage occurs in the forest litter (fine fuels) in the harvested areas compared to the control, a prescribed fire through harvested areas has a greater potential to emit larger amounts of carbon. The actual amount of carbon that is emitted will largely depend upon how complete the combustion process is, and whether it results in flaming or smoldering combustion (Rowell and Levan-Green, 2005). Factors that will determine the type of combustion is fire intensity (temperature), type of fuel (fine vs coarse), and moisture.
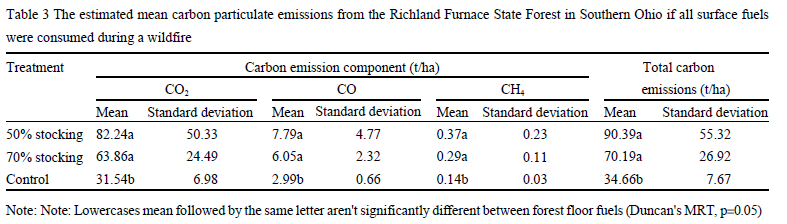 Table 3 The estimated mean carbon particulate emissions from the Richland Furnace State Forest in Southern Ohio if all surface fuels were consumed during a wildfire |
Dead fuels are often categorized into fuel diameter classes named according to the timelag principle (Pyne et al., 1996), where small diameter fuels change rapidly in response to weather changes, while larger diameter fuels are slower to respond. A timelag is the time required for a fuel particle to reach 63% of the difference between the initial moisture content and the equilibrium moisture content (or equilibrium with changed atmospheric conditions). The categories are named for the “midpoint” of the response time of each fuel category: 1-hour fuels respond in less than 2 hours, 10 hours fuels respond in 2 to 20 hours, 100 hours fuels respond in 20 to 200 hours, and 1 000 hours fuels respond in greater than 200 hours. The data in this study did not permit the separation of 1 hour fuels from 10 hours fuels. Accordingly, these two categories were combined in the fuel analysis.
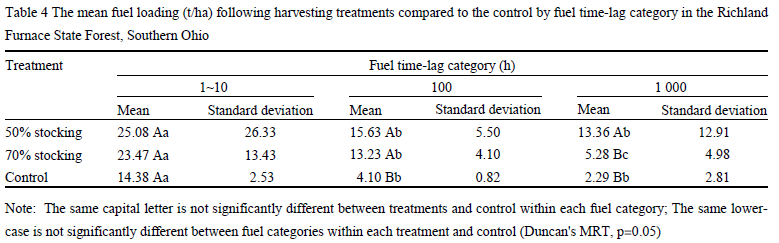
Harvesting created more deadwood fuels overall; however the total fuel loading is probably not the best indicator of fire behavior. Higher amounts of the 1 to 10hours fuels were created as a result of harvesting even though it was found not to be significantly higher than the control (table 4). It is these fuels, commonly referred to as fine fuels, which will most likely determine fire intensity and sustainability (Schoennagel et al., 2004). These fine fuels primarily determine fire behavior and rate of spread (Anderson and Brown, 1987; Brown and Davis, 1973; Brown, 1970;Davis, 1959). With the higher loading of fine fuels in the treatment areas, a prescribed burn will more than likely be better sustained through these areas with higher intensity than a burn in the control. The more open forest canopy will allow these fuels to dry more quickly and thus make them more available.
Harvesting created more heavy fuels (100 hours and 1 000 hours) compared to the control (table 4). Both harvesting treatments created significantly more 100 hours fuels than measured in the control, and the 50% stocking treatment created more 1 000 hours fuels than the 70% stocking treatment and the control. Heavy fuels take longer to ignite, spread slower, burn longer and throw off large volumes of heat when dry. Typically heavy fuels are less available than light fuels.
Table 4 The mean fuel loading (t/ha) following harvesting treatments compared to the control by fuel time-lag category in the Richland Furnace State Forest, Southern Ohio |
Heavy fuels in eastern hardwood forests will not typically be a fire behavior factor during a prescribed burn. These heavy fuels would become more available under drought or dry conditions, and if the rate of fire spread is slow. The accumulation of fine fuels around the heavy fuels could also cause these heavy fuels to become involved by allowing prolonged contact with heat. If heavy fuels become involved, they would burn and smolder longer, and produce greater output of heat, thus creating sources of firebrands and continued heating during the smoldering phase. This creates potential rekindling issues during the mop up phase of a prescribed burn. Slow moving fires through heavy fuels can transfer large amounts of heat to mineral soil or oil organisms (Rollins et al., 1993). During forest fires, maximum ground temperatures may reach 200~300℃; However under heavy fuels ground temperatures may exceed 1 500℃ while the surface temperatures in these locations is 500~700℃ (Neary et al., 1999). Surface temperatures ranging from 175~275℃ have been recorded for prescribed burns in Southern Ohio, depending on season of burn, slope position, and slope aspect (Schwe- mlein and Williams, 2007).
It is most likely that a prescribed burn performed in these forests would consume the 1 hour and 10 hours fuels. It would be rare that the 100 hours and 1 000 hours fuels would become involved in most prescribed burns in eastern hardwood forests. With this assumption, along with the assumption of average combustion efficiency and fuel moisture during a prescribed burn when applying emission factors reported by Battye and Battye (2002; http://www. epa.gov/ttn/chief/ap42/ch13/ related/firerept.pdf), and the estimated carbon emissions from a prescribed burn are reported in table 5. It is apparent that prescribed burning would emit lower amounts of carbon than if all surface fuels were consumed in a wildfire event.
Narayan et al. (2007) found this to be the case when analyzing wildfire and prescribed burn data in Europe. Prescribed burning, although itself a carbon source, can be an effective management tool for reducing fuel loads and preventing greater emissions as the result of wildfire.
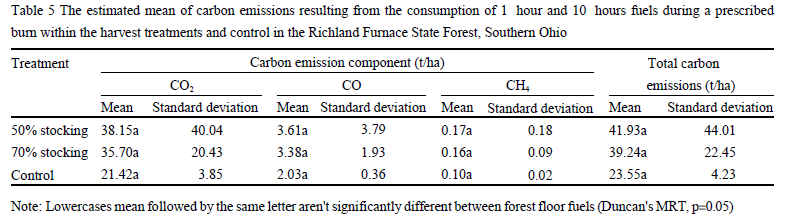 Table 5 The estimated mean of carbon emissions resulting from the consumption of 1 hour and 10 hours fuels during a prescribed burn within the harvest treatments and control in the Richland Furnace State Forest, Southern Ohio |
The amount of fuel consumed during a fire is a key variable in modeling fire effects (Peterson et al., 1987). The amount of fuel consumed will vary, based on fuel load, ecosystem type (fuel type), fuel moisture, weather, and fire behavior. It was found that the variability in fuel consumption during burning in Alaska is the main driver of uncertainty in the emission of carbon-based greenhouse gases from wildland fires (French et al., 2004), and this variability is both spatial and temporal in nature.
2.3 Conclusions
Forest harvesting in eastern hardwood forests contributes significantly to fuel loading. Harvesting created significantly more total surface fuels compared to the control, with the largest percentage of these fuels contained in the deadwood material (>5 cm diameter). The higher harvest intensity (50% treatment) created significantly more deadwood material than the lower intensity (70%), with both treatments having significantly more deadwood than the control. Increase in harvest intensity leads to higher residual fuel loading. The amount of carbon stored within these fuels follows the same trends.
Forest managers need to give consideration to the subsequent fuel loading that result from various harvest intensities, which could create increased risks of wildfire through these stands. Harvesting increased the amount of 1 to 10 hours fuels on the forest floor, which are the fuels most likely to influence fire behavior and determine its sustainability. Harvesting also increased the amount of 100 hours and 1 000 hours fuels, but to a lesser extent. The greatest increase in the 1 000 hours fuel category occurred with the most intensive harvest.
Wildfire is more likely when weather conditions are hot and dry, particularly over extended periods, which make more fuel available. Accordingly, wildfire tends to display more extreme fire behavior and consume more fuel. In the case of this study wildfire could have the potential of releasing 70~90 t/ha of carbon emissions into the atmosphere in post-harvest stands compared to 35 t/ha in unharvested stands.
Prescribed fire on the other hand is often implemented under conditions less favorable for wildfire, but conducive enough to carry fire. Accordingly, only the 1 to 10 hours surface fuels that have the greatest influence on fire behavior are typically consumed. Normally, emissions from prescribed fire are less than what is emitted from wildfire (Liu, 2004). In the case of this study, if prescribed fire consumed 1 hour and 10 hours fuels, the estimated carbon emissions from harvested areas would be 39~42 t/ha, compared to 24 t/ha from unharvested areas. The use of prescribed fire can reduce the wildfire risks and the associated carbon emissions from these events. Accordingly, it may be worthwhile to account for the reduction in carbon emissions obtained when prescribed burns are implemented as a fuel reduction strategy (Narayan et al., 2007) in carbon offset projects. In the case of harvested stands this could mean a total carbon emission reduction of 44%~55%, whereas in unharvested stands the emissions could be reduced 32%.
3 Materials and Methods
3.1Field Methods
This study was part of a larger study to examine the effects of combined shelterwood harvests and prescribed fire on establishment of oak regeneration in the Richland Furnace State Forest. Shelterwood harvests of two different intensities were implemented-reduction of the forest to 70% stocking (less intensive) and reduction to 50% stocking (more intensive). The percent stocking (forest density) was determined by using stocking charts for upland hardwoods (Gingrich, 1967). A mechanical cut-to-length harvesting system was used to harvest stands. Three to five years following these harvests a prescribed burn will be introduced once the oak regeneration and its competitors have established. One set of 70% and 50% stocking treatments will receive a spring burn, and another set a fall burn. These treatments will be compared to a control, in which no harvesting or bur- ning treatments will occur. The data collection for this study occurred one growing season following harvest so no burning had taken place.
Richland Furnace State Forest (44.769°N, 117.168°W) lies within the unglaciated Allegheny Plateau Region, and is extensively dissected by watershed drains that exhibit undulating and rough topography. Elevation within the region ranges from the lowest point of 180 m to the highest point of 320 m above sea level. The total annual precipitation is 104 cm, with over half of this precipitation occurring of April through September. The forest was dominated by oak and other mixed hardwood species (table 6). The basal area averaged 24.3 m2/ha with 326 trees/ha, where oak and hickory accounted for 84 percent of the basal area. While the residual stand targets for the shelterwood harvest intensities were 70% and 50% stocking, actual residual stocking was 65% and 43%, respectively, based on plot data (table 7).
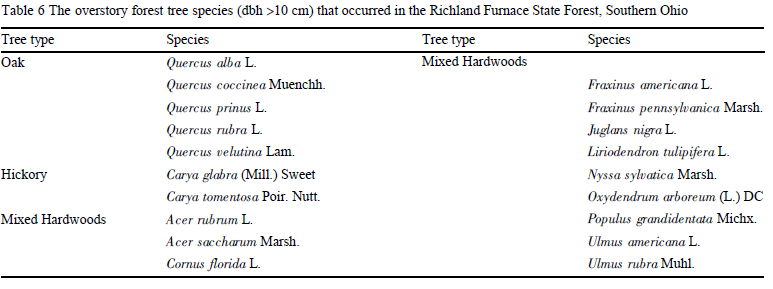 Table 6 The overstory forest tree species (dbh >10 cm) that occurred in the Richland Furnace State Forest, Southern Ohio |
Table7 Stand attributes for the control and the treatments before and after harvest in Richland Furnace State Forest in southern Ohio |
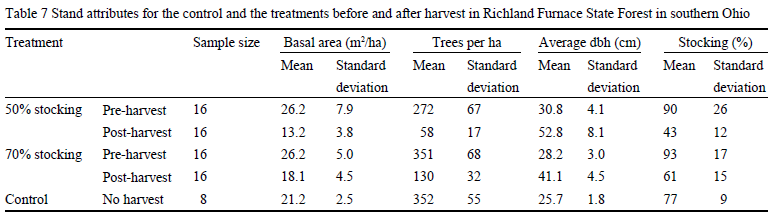
The fuel data collected for this study utilized the sampling design of the larger study. Each treatment and control was 10-ha in size, and each contained eight 0.08-ha circular sample plots. The center of each of these plots served as the sample point for this study. Since prescribed burning usually is administered in late fall (after onset of dormancy) or early spring before bud break, data was collected during winter months in order to characterize the available fuel during these burning seasons.
Four fuel plots were located within each of the 0.08-ha overstory plots along transects perpendicular to each other, bisecting the overstory plot center, and oriented in an east-west and north-south directions. Each fuel plot, 1 m2 in size, was established along these transects 14 m from the plot center.
All woody vegetation that is<1.4 m in height was clipped at the groundline from the fuel plots. These stems were cut into manageable pieces, placed in labeled sample bags in the field, and brought back to the lab for further analysis.
Due to the potential of large volumes of herbaceous and forest litter on these fuel plots, 0.1 m2 sub- sample plots were utilized, randomly locating the sub-sample plot within the 1 m2 plot. The percent cover of herbaceous and forest litter was recorded on both the fuel plot and sub-sample plot. All herbaceous and forest litter material were gathered from the sub-sample plot, placed in labeled sample bags, and brought back to the lab for further analysis. A dry weight to percent cover ratio of herbaceous material and forest litter material was developed for each sub-sample plot and applied to he 1 m2 fuel plot. All forest litter material on sub-sample plot was collected down to the mineral soil, and all coarse woody material that was <5 cm diameter was considered a part of the litter.
Coarse woody debris for this study was defined as all dead wood material that was greater than 5 cm diameter. A sampling method for coarse woody debris described by Brown et al. (2004) was modified and used in this study. Two 50 m transects were placed through the plot center at right angles to each other, in a north-south and east-west direction. Dead wood that is>5 cm diameter and intersects these lines were measured, and the diameter at the point of intersection of each piece was recorded. Deadwood was measured if: (a) more than 50% of the log is above ground and (b) the sampling line crosses through at least 50% of the diameter of the log. Each measured piece was assigned to one of three density states: sound, intermediate, or rotten. Dead wood samples representing the three density classes and the range of species present were collected in the field and brought back to the lab for density (dry weight per green volume) determination.
3.2 Laboratory Methods
Grab samples were taken of all woody, herbaceous, and forest litter samples for the purpose of determining moisture content. These grab samples were oven-dried at 60℃ for 72 hours or until constant weight was ach- ieved, so that the oven-dry weight of woody, herbaceous, and forest litter material could be determined.
Coarse woody debris samples were likewise dried in ovens at 60℃ for 72 hours, or until constant weight was achieved. For each density class of deadwood, the volume was calculated separately as follows: Volume (m3/ha)=π2×[(d12+d22…dn2)/8L], where d1, d2, etc=diameters of intersecting pieces of dead wood and L=length of the line (Brown et al., 2004). Density was calculated with the formula: Density=mass (g)/volume (cm3); where: mass=the mass of the oven-dried sample; volume=π×(average diameter/2)2×average length of the sample. In cases where it was difficult to determine dimensions due to state of decay, the water displacement method was used to determine volume.
At least 0.04 g of sample and usually more was collected from representative samples of woody, herbaceous, and forest litter material the purpose of determining carbon content. These carbon samples were ground in a Wiley mill to pass a 2 mm sieve, and carbon analysis was run on an Elementar Americas, Inc., Vario Max Carbon Nitrogen Combustion Analyzer, with a procedure described in the international standard publication ISO10694:1995 (E). The amount of carbon measured in the samples by this method was expressed in units of percent carbon by dry weight.
3.3 Statistical Methods
Analysis of Variance (ANOVA) was performed on the data to determine differences among the treatments and the control. Duncan's multiple range test about the means was used to determine significant differences (p=0.05) of fuel loading and carbon between treatments and the control.
Acknowledgements
The authors wish to acknowledge the Ohio Depar- tment of Natural Resources, Division of Forestry for their cooperation and assistance with this study.
References
Abraham S., 2004, The bush administration's approach to climate change, Science, 305(5684): 616-617 doi:10.1126/science.1098630 PMid:15286350
Abrams M.D., 1992, Fire and the development of oak forests, Bioscience, 42: 346-353 doi:10.2307/1311781
Anderson H.E., and Brown J.K., 1987, Fuel characteristics and fire behavior considerations in the wildlands, In: Symposium and workshop on protecting people and homes from wildfire in the interior west, Missoula, MT, USDA Forest Service, Intermountain Research Station, pp.124-130
Barton D.C., Vose J.M., and Swank W.T., 1996, Shifts in aboveground and forest floor carbon and nitrogen pools after felling and burning in the southern Appalachians, Forest Science, 42: 431-441
Birdsey R.A., 2006, Carbon accounting rules and guidelines for the United States Forest Sector, J. Environ. Qual., 35: 1518-1524 doi:10.2134/jeq2005.0193 PMid:16825472
Brack C., 2002, Pollution mitigation and carbon sequestration by an urban forest, Environmental Pollution, 116(Sup1): S195-S200
Brose P.H., van Lear D.H., and Cooper R.D., 1999, Using shelterwood harvests and prescribed fire to regenerate oak stands on productive upland sites, Forest Ecology and Management, 113: 125-141 doi:10.1016/S0378-1127(98)00423-X
Brown S., Shoch D., Pearson T., and Delaney M., 2004, Methods for measuring and monitoring forestry carbon projects in California, Research report prepared by Winrock International for the California Energy Commission Public Interest Energy Research Program, Research, Report No. 500-04-072F, pp.40
Brown A.A., and Davis K.P., 1973, Forest fire control and use, 2nd edition, McGraw-Hill Publishers, pp.686
Brown J.K., 1970, Ratios of surface area to volume for common fine fuels, Forest Science, 16(1): 101-105
Caldeira K., Morgan M.G., Baldocchi D., Brewer P.G., Chaen C.T.A., Nabuurs G.J., Nakicenovic N., and Robertson G.P., 2004, A portfolio of carbon management options, In: Field C.B., and Raupach M.R. (eds.), The global carbon cycle, Island Press, Washington D.C., pp.103-129
Canary J., Harrison R., Compton J., and Chappell H., 2000, Additional carbon sequestration following repeated urea fertilization of second-growth Douglas fir stands in western Washington, Forest Ecology and Management, 138(1-3): 225-232 doi:10.1016/S0378-1127(00)00398-4
Davis K.P., 1959, Forest fire control and use, 1st edition, McGraw-Hill publishers, USA, pp.584
Dieter M., and Elsasser P., 2002, Carbon stocks and carbon stock changes in the tree biomass of Germany's forests, Forstwis- senschaftliches Centralblatt, 121(4): 195-210 doi:10.1046/j.1439-0337.2002.02030.x
French N.H.F., Goovaerts P., and Kasischke E.S., 2004, Uncertainty in estimating carbon emissions from boreal forest fires, Journal of Geophysical Research, 109(D14S08): 12
Gingrich S.P., 1967, Measuring and evaluating stocking and stand density in upland hardwood forests in the Central States, Forest Science, 13(1): 38-53
Hughes R.F., Kauffman J.B., and Jaramillo V.J., 1999, Biomass, carbon, and nutrient dynamics of secondary forests in a humid tropical region of Mexico, Ecology, 80: 1892-1907 doi:10.2307/176667
Jackson S.W., and Buckley D.S., 2004, First-year effects of shelterwood cutting, wildlife thinning, and prescribed burning on oak regeneration and competitors in Tennessee oak-hickory forests, In: Connor Kristina F. (ed.), Proceedings of the 12th biennial southern silvicultural research conference, Gen. Tech. Rep. SRS-71, Asheville, NC: U.S. Department of Agriculture, Forest Service, Southern Research Station, pp.231-237
Jenkins M.A., Webster C.R., Parker G.R., and Spetich M.A., Coarse woody debris in managed central hardwood forests of Indiana, USA, For. Sci. 50(6): 781-792
Kasischke E.S., Hyer E.J., Novelli P.C., Bruhwiler L.P., French N.H.F., Sukhinin A.I., Hewson J.H., and Stocks B.J., 2005, Influences of boreal fire emissions on Northern Hemisphere atmospheric carbon and carbon monoxide, Global. Biogeochem. Cycles, 19(GB1012): 16
Kimble J., Heath L., Birdsey R., and Lal R., 2003, The potential for U.S. forest soils to sequester carbon and mitigate the greenhouse effect, CRC Press, Boca Raton, Fl, pp.429
Koch P., 1989, Estimates by species group and region in the USA of: I. Below-ground root weight as a percentage of ovendry complete-tree weight; and II. Carbon content of tree portions, Consulting report, pp.23
Liu Y.Q., 2004, Variability of wildland fire emissions across the contiguous United States, Atmospheric Environment, 38: 3489-3499 doi:10.1016/j.atmosenv.2004.02.004
Loftis D.L., 1983, Regenerating southern appalachian mix hardwoods with the shelterwood method, Southern Journal of Applied Forestry, 7: 212-217
Lorimer C.G., 1984, Development of the red maple understory in northeastern oak forests, Forest Science, 30(1): 3-22
Lorimer C.G., 1993, Causes of the oak regeneration problem, In: Loftis D., and McGee C.E. (eds.), Oak regeneration: Serious problems, practical recommendations, USDA forest serv., Southeast, Forest Exp. Sta., Gen. Tech. Rep. SE-84, pp.14-39
Makundi W., Sathaye J., and Ketoff A., 1995, Copatha spreadsheet model for the estimation of carbon flows associated with the use of forest resources, Biomass and Bioenergy, 8: 369-380 doi:10.1016/0961-9534(95)00044-5
Narayan C., Fernandes P.M., van Brusselen J., and Schuck A., 2007, Potential for CO2 emissions mitigation in Europe through prescribed burning in the context of the Kyoto protocol, Forest Ecology and Management, 251: 164-173 doi:10.1016/j.foreco.2007.06.042
Neary D.G., Klopatek C.C., DeBano L.F., and Fgolliott P.F., 1999, Fire effects on belowground sustainability: a review and synthesis, Forest Ecology and Management, 122(1-2): 51-71 doi:10.1016/S0378-1127(99)00032-8
Nicodemus M.A., and Williams RA., 2004, Quantifying aboveground carbon storage in managed forest ecosystems in Ohio, In: Yaussy D.A., Hix D.M., Long R.P., and Goebel P.C. (eds.), Proceedings of the 14th central hardwood forest conference, Gen. Tech. Rep. NE-316, Newtown Square, PA: U.S. Department of Agriculture, Forest Service, Northeastern Research Station, pp.232-240
Nowak D., 1993, Atmospheric carbon reduction by urban trees, Journal of Environmental Management, 37: 207-217 doi:10.1006/jema.1993.1017
Nowak D., and Crane D., 2002, Carbon storage and sequestration by urban trees in the USA, Environmental Pollution, 116: 381-389 doi:10.1016/S0269-7491(01)00214-7
Pacala S., and Socolow R., 2004, Stabilizing wedges: solving the climate problem for the next 50 years with current technologies, Science, 305: 968-972 doi:10.1126/science.1100103 PMid:15310891
Patenaude G., Briggs B., Milne R., Rowland C., Dawson T., and Pryor S., 2003, The carbon pool in a British semi-natural woodland, Forestry, 76(1): 109-119 doi:10.1093/forestry/76.1.109
Peterson D.L., ArbaughM.J., WakefieldV.A., and MillerP.R., 1987, Evidence of growth reduction in ozone-stressed Jeffrey pine (Pinus jeffreyi Grev. and Balf.) in Sequoia and Kings Canyon National Parks, Journal of the Air Pollution Control Association, 37: 906-912
Pyne S.J., Andrews P.L., and Laven R.D., 1996, Introduction to wildland fire, John Wiley and Sons Publishers, New York, NY, pp.769
Reich P.B., Abrams M.D., Ellsworth D.S., Kruger E.L., and Tabone T.J., 1990, Fire affects ecophysiology and community dynamics of central Wisconsin oak forest regeneration, Ecology, 71: 2179-2190 doi:10.2307/1938631
Rollins M.S., Cohen A.D., and Durig J.R., 1993, Effects of fires on the chemical and petrographic composition of peat in the Snuggedy Swamp, South Carolina Int. J. Coal Geol., 22(2): 101-117 doi:10.1016/0166-5162(93)90020-B
Rowell R.M., and Levan-Green S.L., 2005, Thermal properties, In: Rowell R.M. (ed.), Handbook of wood chemistry and wood composites, CRC Press, Boca Raton, FL, pp.121-138
Sander I.L., 1979, Regenerating oaks with the shelterwood system, In: Holt H., and Fischer B. (eds.), Proceedings of John S. Wright forestry conference-regenerating oaks in upland hardwood forests, Purdue University, West Lafayette, pp.54-60
Sander I.L., McGee C.E., Day K.G., and Willard R.E., 1983, Oak-hickory, In: Burns, R.M. (ed.), Silvicultural systems of the major forest types of the United States, Agriculture Handbook 445, USDA Forest Service, Washington D.C., pp.116-120
Schoennagel T., Veblen T.T., and Romme W.H., 2004, The interaction of fire, fuels, and climate across Rocky Mountain forests, Bio. Science, 54: 661-676 doi:10.1641/0006-3568(2004)054[0661:TIOFFA]2.0.CO;2
Schuler T.M., and Miller G.W., 1995, Shelterwood treatments fail to establish oak reproduction on mesic forest sites in West Virginia-10-year results, In: Gottschalk K.W., and Fosbroke S.L. (eds.), Proceedings of the 10th central hardwood forest conference, Gen. Tech. Rep. NE-197, Radnor PA: U.S., Department of Agriculture, Forest Service, Northeastern Forest Experiment Station, pp.375-386
Schwemlein D.J., and Williams R.A., 2007, Effects of landscape position and season of burn on fire temperature in southern Ohio's mixed-oak forests, In: Buckley D.S., and Clatterbuck W.K. (eds.), Proceedings of the 15th central hardwood forest conference, e-Gen. Tech. Rep. SRS-101, U.S. Department of Agriculture, Forest Service, Southern Research Station, pp.250-257
Sutherland E.K., and Hutchinson T.F., 2003, Characteristics of mixed oak forest ecosystems in southern Ohio prior to the reintroduction of fire, Gen. Tech. Rep. NE-299, Newtown Square, PA: U.S., Department of Agriculture, Forest Service, Northeastern Research Station, pp.159
van Lear D.H., and Watt J.M., 1993, The role of fire in oak regeneration, In: Loftis D.L., and McGee C.E. (eds.), Oak regeneration-serious problems, practical recommendations, Gen. Tech. Rep. SE-84, U.S., Department of Agriculture, Forest Service, Southeastern Forest Experiment Station, pp.66-78
Woodall C.W., Oswalt S.J., and Morin R.S., 2007, Attributes of down woody materials in hardwood forests of the eastern United States, In: Buckley D.S., and Clatterbuck W.K. (eds.), Proceedings of the 15th central hardwood forest conference, e-Gen. Tech. Rep. SRS-101, U.S., Department of Agriculture, Forest Service, Southern Research Station, pp.144-153


. PDF(205KB)
. FPDF
. HTML
. Online fPDF
Associated material
. Readers' comments
Other articles by authors
. Yuhua Tao
. Williams Roger Allen
Related articles
. Carbon
. Emissions
. Harvesting
. Fire
. Forest fuel load
Tools
. Email to a friend
. Post a comment