Research Article
Environmental Risk Assessment of Heavy Metals in Sediment of Nun River around Gbarantoru and Tombia Towns, Bayelsa State, Nigeria 
2 Department of Biological Sciences, Faculty of Science, Niger Delta University, Wilberforce Island, Bayelsa State, Nigeria
 Author
  Correspondence author
Biological Evidence, 2018, Vol. 8, No. 3 doi: 10.5376/be.2018.08.0003
Received: 08 Apr., 2018 Accepted: 21 May, 2018 Published: 01 Jun., 2018
Aghoghovwia O.A., Izah S.C., and Miri F.A., 2018, Environmental risk assessment of heavy metals in sediment of Nun River around Gbarantoru and Tombia Towns, Bayelsa State, Nigeria, Biological Evidence, 8(3): 21-31 (doi: 10.5376/be.2018.08.0003)
This study evaluated the environmental risk assessment of sediment heavy metals of Nun River at Gbarantoru and Tombia town in Bayelsa state, Nigeria. Sediment samples were collected in triplicate from three locations (viz: Location A around oil and gas installations, B- Gbarantoru and C- Tombia town). The samples were dried, processed and heavy metals concentration was determined using atomic adsorption spectrometry. Heavy metals results in the sediment ranged from 0.005 – 0.012 mg/kg cadmium, 0.001 – 0.003 mg/kg chromium, 0.001 – 0.002 mg/kg cobalt, 0.001 – 0.032 mg/kg nickel, 0.007 – 0.017 mg/kg lead, 0.082 – 0.126 mg/kg zinc and 0.138 – 0.314 mg/kg iron. There was significant variation (P<0.05) among the different various locations. The heavy metals showed positive significant correlations (P<0.05). The results showed low to moderate risk for contamination factor, degree of contamination and pollution load index; low to moderate contamination for index of geo-accumulation. Over 50% of the heavy metals in the various locations had positive quantification of contamination, which suggest pollution due to anthropogenic activities. On the overall, the ecological risk was within low risk. Hence, there is the need for sustainable management of anthropogenic activities that could impact on water and sediment quality.
Background
The aquatic ecosystem is a habitat to several species of fish including shelled and fin fishes (Ogamba et al., 2017a). In the coastal region of Nigeria, especially in Bayelsa state, the aquatic ecosystem is the major recipients of municipal wastes as well as sewage (Izah and Angaye, 2016a; b; Seiyaboh and Izah, 2017a). Authors have variously reported that pier toilet system are built in surface water system in Bayelsa state (Agedah et al., 2015; Ogamba et al., 2015a; Seiyaboh et al., 2017a; Kigigha et al., 2018). Wastewater resulting from bathroom is also channeled directly to the surface water resources (Epie creek) in Bayelsa state (Ben-Eledo et al., 2017a; b). Surface water equally receives waste resulting from slaughterhouse activities in Bayelsa state (Ogamba et al., 2015b; Seiyaboh and Izah, 2017b). Agricultural activities are another indirect cause of water pollution. Remains of empty cans of herbicides, and runoff from fields, where chemical fertilizers were applied end up in nearby aquatic ecosystem.
In addition, several oil and gas installations are found in the Niger Delta region. Activities such as dredging, canalization, oil and gas exploration on water are some of the activities that could lead to variation in aquatic ecosystem. Ohimain et al. (2008) reported variation in surface water heavy metals due to dredging. Angaye et al. (2015) reported effects of wastes leachate on heavy metals level in some dumpsites aligning surface water.
Typically, heavy metals in the environment are majorly due to anthropogenic activities and to lesser extent by natural effects (Ogamba et al., 2017a). Authors have variously reported that heavy metals are metalloid with relative high atomic weight and specific gravity of ≥ 5 cm3 (Idris et al. 2013; Izah et al., 2016, 2017a; Izah and Anagye, 2016a). Heavy metals have the tendency to persist in the environment and bioaccumulate in living things (Izah and Angaye, 2016a). Some of heavy metals including manganese, chromium, nickel, cobalt, iron, copper, zinc etc are essential because they are required by living organisms at certain concentration. While several others including cadmium, lead, arsenic and mercury is highly toxic even at low concentration (Izah et al., 2016; Izah and Angaye, 2016a).
In the Niger Delta region of Nigeria several inland water systems are available (Ogamba et al., 2017a). Several anthropogenic activities such as transportation, dredging, recreation (swimming), washing, fishing etc are often carried out in the water ways (Ogamba et al., 2017a). The effect of these activities could reflect in the sediment of the water as well. Typically, sediment quality has a relationship with water quality (Seiyaboh et al., 2016a; Kigigha et al., 2018). Since surface water is a habitat to several aquatic organisms, an alteration in water and sediment quality could influence the fish composition, distribution, abundance etc in such water system (Ogamba et al., 2017a).
Environmental risk assessment posed by heavy metals is used to show the extent of pollution due an activity (Izah et al., 2017b). Several indices are available for assessing the level of heavy metal contaminant in an environment (viz: soil, sediment and water). Some of these indices include index of geo-accumulation (Muller, 1969; Ghaleno et al., 2015; Bhutiani et al., 2017; Izah et al., 2017c), contamination factor, degree of contamination (Hakanson, 1980; Singovszka et al., 2014; Bhutiani et al., 2017; Izah et al., 2017b), pollution load index (Tomlison et al., 1980; Bhutiani et al., 2017; Izah et al., 2017d), quantification of contamination (Bhutiani et al., 2017), ecological risk index (Hakanson, 1980; Bhutiani et al., 2017; Izah et al., 2018).
In Bayelsa state, several studies have been carried with regard to surface water quality (Agedah et al., 2015; Ogamba et al., 2015a-c; Seiyaboh et al., 2017a,b; Aghoghovwia et al., 2018) and sediments (Inengite et al., 2010; Seiyaboh et al., 2016a; b; 2017c; Ogamba et al., 2017b; Kigigha et al., 2018). But information of the potential ecological risk of heavy metals in sediment of lower Nun River is scanty in literature. Hence, this study aimed at assessing the environmental risk assessment of heavy metals in sediment of Nun River at Tombia and Gbarantoru in Yenagoa local government Area of Bayelsa state, Nigeria.
1 Materials and Methods
1.1 Study area
The study area (Tombia town and Gbarantoru) is in Yenagoa local Government area of Bayelsa state. The area is within the sedimentary basin (Kigigha et al., 2018; Aghoghovwia et al., 2018). Oil and gas facilities, dredging (using motorized and artisan methods), fishing, swimming, boating are some of the common activities being carried out along the lower Nun River in Bayelsa state (Aghoghovwia et al., 2018). The Nun River is also a major recipient of wastes streams resulting from human activities especially at household level (Aghoghovwia et al., 2018). Probably due to the topography of the area, Nun River receives runoff resulting from rainfall. Fish farming is a major occupation of indigenous people of the area. The climatic condition of the area is similar to other regions of Bayelsa state that have been previously reported by authors (Agedah et al., 2015; Izah et al., 2015; Ogamba et al., 2015a; b; c; Seiyaboh et al., 2016a; b; Seiyaboh and Izah, 2017a).
1.2 Sampling techniques
Triplicate samples of the sediment were collected from three different locations (A-around oil and gas installations, B-Gbarantoru and C-Tombia town for three consecutive months i.e. December 2017 to February 2018). The sediment samples were obtained from respective sampling sites with the aid of Eckman grab and packaged with aluminum foil plates. The samples were properly labeled, and transported to the laboratory in an ice pack less than an hour after sample collection where they were processed and analyzed.
1.3 Sample preparations
Acid digestion was employed for the preparation of the sediment samples. The sediment samples were air dried for 24 hours and then transferred into an oven set at 70ºC for 6 hours. Then 5.0 g of the sediment samples was weighed into a 100 ml beaker, and 10 ml of concentrated nitric acid was added to the samples. The mixture was heat continuously with stirring until a clear solution formed. The mixture was then discontinued and allowed to cool. There after, 20 ml of distilled water was added and it was mixed properly. The mixture was then filtered into a 100 ml volumetric flask, which was made up to the mark with distilled water.
1.4 Sample analysis using atomic adsorption spectrophotometer
The digested samples were aspirated into the Atomic absorption spectrophotometer (AAS) set at varying wavelengths. The resultant values displayed were recorded.
1.5 Environmental Risk Assessment
Environmental risk assessment is a tool to used ascertains level of impact of heavy metals due to anthropogenic activities in the ecosystems (viz: water, sediment and soil). Several studies have widely used different set of data as reference background values. Some of the commonly used data include geometric mean (Thambavani and Uma Mageswari, 2013; Bhutiani et al., 2017; Izah et al., 2017b-d; 2018) and median mean (Monakhov et al., 2015; Bhutiani et al., 2017; Izah et al., 2017b-d, 2018) of contaminated locations and arithmetic mean of the control (unpolluted location). The use of geometric mean and median mean has been applied by authors (Bhutiani et al., 2017; Izah et al., 2017b-d; 2018). As such both background mean were used in this study.
The indices studied include contamination factor, degree of contamination, pollution load index, index of geo-accumulation, quantification of contamination, ecological risk and ecological risk index. The resultant values of the environmental risk are compared to the values presented in Table 1.
.png) Table 1 Standard for comparison for the various indices Note: Geo-accumulation index is by Muller (1969) have been widely applied by Ghaleno et al. (2015), Bhutiani et al. (2017), Todorova et al. (2016), Izah et al. (2017c); Note: CF, CD, ER, R” was developed by Hakanson (1980) and have been widely applied by Bhutiani et al. (2017), Izah et al. (2017d, 2018), Singovszka et al. (2014), Todorova et al. (2016); PLI have been widely applied in environment risk assessment by Tomlinson et al. (1980), Bhutiani et al. (2017), Izah et al. (2017d) |
1.6 Contamination factor
Contamination factor (CF) is used to show pollution level in relative to average concentration of the respective heavy metals in the environment (Izah et al., 2017d). Contamination factor was developed by Hakanson (1980).
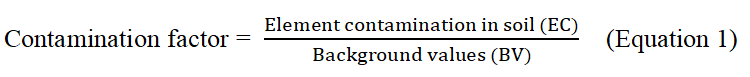
Where, EC is the mean concentration of each metal under study, while BV is the background value
1.7 Contamination degree
Degree of contamination (CD) is the summation of the contamination factors (Singovszka et al., 2014; Bhutiani et al., 2017; Izah et al., 2017d). Contamination degree was developed by Hakanson (1980).

1.8 Pollution load index
Pollution load index (PLI) is used to show level of heavy metals toxicity in respect to the various locations (Tomlinson et al., 1980; Izah et al., 2017d; Bhutiani et al., 2017). Pollution load index have been previously described by Tomlinson et al. (1980) and have been applied by Bhutiani et al. (2017), Izah et al. (2017d).

Where, CF = contamination factor
1.9 Quantification of contamination
Quantification of contamination (QoC) is used to represents the lithogenic metal (Asaah et al., 2006; Bhutiani et al., 2017; Izah et al., 2017c). Quantification of contamination index have been applied in different environmental components including water (Bhutiani et al., 2017) and soil (Izah et al., 2017c).
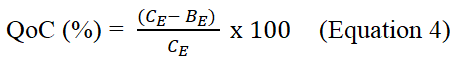
Where QoC is quantification of contamination, CE is the concentration of metal in the sample and BE is the background of the elemental concentrations.
1.10 Geo-accumulation index
Geo-accumulation index (Igeo) is used to determine the level of pollutant associated with anthropogenic activities (Bhutiani et al., 2017; Izah et al., 2017c). Geo-accumulation index was developed by Muller (1969) and have been severally applied by authors (Hassaan et al., 2016; Kowalska et al., 2016; Todorova et al., 2016; El-Metwally et al., 2017; Bhutiani et al., 2017; Izah et al., 2017c; Gasiorek et al., 2017).
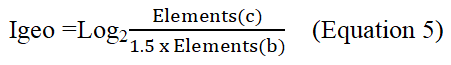
Where Elements (c) is the measured concentration of heavy metals in the sample, Element (b) is the background value for the heavy metals; 1.5 is a constant factor used in the calculation because of possible variations of the background data due to lithological differences.
1.11 Ecological risk index
Ecological risk index (ERI) is used to assess the extent a particular activity posed to the environment. The Potential ecological risk (ER) is calculated for each individual metals, while the summation of ecological risk based on location and it’s often expressed as R’ (Singovszka et al., 2014; Izah et al., 2018). Both ER and R’ was developed by Hakanson (1980) and have been applied by Bhutiani et al. (2017), Izah et al. (2018), Mazurek et al. (2017), Kowalska et al. (2016), Gasiorek et al. (2017), Todorova et al. (2016).
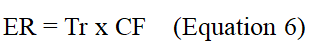
Where Tr is the toxic response factor viz: Pb = 5, Cd = 30, Cr = 2, and Zn = 1 (Hakanson, 1980), Ni = 5 (Xu et al., 2008; Soliman et al., 2015; Bhutiani et al., 2017), Co = 5 (Swarnalatha et al., 2013) and CF represents the contamination factor.

1.12 Statistical analysis
SPSS version 20 was used to carry out the statistical analysis. The sediment heavy metals were presented as mean ± standard error. One way analysis of variance was carried out at P=0.05. Tukey Honestly significant difference was used to compare mean of the different locations. Spearman rho correlation matrix was used to show the relationship between the various parameters studied. Geometric mean was calculated using Paleontological statistics software package by Hammer et al. (2001).
2 Results and Discussion
The level of heavy metals in sediment of Nun River at Gbarantoru and Tombia towns in Bayelsa state is presented in Table 2. While the correlation matrix of the parameters studied is presented in Table 3. The concentration of cadmium in the sediment ranged from 0.005-0.012 mg/kg, being not significantly different (P>0.05) apart from Location C (Table 2). Cadmium showed positive significant relationship with chromium (r=0.983), cobalt (r=0.845), nickel (r=0.933), lead (r=0.917), zinc (r=0.950) and iron (r=0.867) at P<0.01 (Table 3).
|
Table 2 Level of heavy metals in sediment along Nun River at Gbarantoru and Tombia towns in Bayelsa state, Nigeria Note: Data is expressed as mean ± standard error (n=3); Different letters across the row indicate significant difference (P<0.05) according to Tukey Honestly Significance difference statistics |
.png)
|
Table 3 Spearman's rho of the sediment quality studied parameters Note: **. Correlation is significant at the 0.01 level (2-tailed); *. Correlation is significant at the 0.05 level (2-tailed); N=9; n=3 |
.png)
The level of chromium in the sediment ranged from 0.001-0.003 mg/kg, and was significantly different (P<0.05) between the various locations (Table 2). Chromium showed positive significant correlation with cobalt (r=0.887), nickel (r=0.950), lead (r=0.900), zinc (r=0.967) and iron (r=0.883) at P<0.01 (Table 3).
The level of cobalt in the sediment ranged from 0.001 – 0.002 mg/kg, and showed significant difference (P<0.05) among the various locations except for Location A (Table 2). Cobalt showed positive significant correlation with nickel (r=0.803), zinc (r=0.837) and iron (r=0.912) at P<0.01, and lead (r=0.678, p<0.05) (Table 3).
Nickel level in the sediment ranged from 0.001-0.032 mg/kg, and differs significantly (P<0.05) among the various locations (Table 2). Nickel showed positive significant correlation with lead (r=0.950), zinc (r=0.967) and iron (r=0.883) at P<0.01 (Table 3).
Lead concentration in the sediment ranged from 0.007-0.017 mg/kg. There was significant variation (P<0.05) among the various locations (Table 2). Lead showed positive significant correlation with zinc (r=0.933) and iron (r=0.817) at P<0.01 (Table 3).
Zinc concentration in the sediment ranged from 0.082-0.126 mg/kg. There was significant variation (P<0.05) among the various locations (Table 2). Zinc showed positive significant relationship iron (r=0.883, P<0.01) (Table 3). The level of iron in the sediment samples ranged from 0.138-0.314 mg/kg. There was significant variation (P<0.05) among the various locations (Table 2).
The sediment showed that there was significant variation (P<0.05) among most of the locations for each of the heavy metals. Furthermore, the results also showed that location A has higher heavy metal concentration compared to Location B and C. This suggests possible human impacts in the areas. Furthermore, all the heavy metals showed positive significant relationship (P<0.05) suggesting that the source of the heavy metals in the sediment is of similar origin. The concentration of the respective heavy metals in sediment had some similarity with the values previously reported in Warri river (Aghoghovwia et al., 2015) and Kolo creek (Ogamba et al., 2017b). This suggests that surface water is a major recipient of anthropogenic activities from both water and land.
Typically, surface water has relationship with water quality (Seiyaboh et al., 2016a; 2017c; Kigigha et al., 2018). As such water contaminants tend to sink in the bottom of the water often called sediment. The values of heavy metals of the water quality tend to be lower compared to the sediment heavy metals concentrations. These trends have been reported by Aghoghovwia et al. (2015) on their study on water and sediment quality of Warri River.
Table 4 presents contamination factor, degree of contamination and pollution load index of the heavy metals concentration in sediment of Nun River at Gbarantoru and Tombia towns in Bayelsa state, Nigeria. The results showed that heavy metals pollution level ranged from low contamination (CF < 1) to moderate contamination (1 ≤ CF <3) for all the heavy metals in the different location under both background scenarios except for Nickel in Location A under geometric mean background scenario. The results also showed that locations A were most contaminated.
.png) Table 4 Contamination factor, degree of contamination and pollution load index of the heavy metal concentration in sediment of Nun River at Gbarantoru and Tombia towns in Bayelsa state, Nigeria |
The degree of contamination of heavy metals in the sediment ranged from low risk (CD<8) to moderate risk (8 ≤ CD<16). The results showed that location A had higher risk compared to locations B and C. This is an indication of varying effects of anthropogenic activities in the different locations. The pollution load index of heavy metals in the sediment was within no pollution (for location C) to moderate pollution (for location A and B). This give overall information that location A and B is more polluted compared to location C under both background considerations. The trend reported in both scenarios had some similarity with the work of Bhutiani et al. (2017), Izah et al. (2017d).
The Index of geo-accumulation of heavy metals in sediment of Nun River at Gbarantoru and Tombia towns in Bayelsa state is presented in Table 5. Under both considerations (median and geometric mean), the index of geo-accumulation were un-contamination (Igeo≤0) except for nickel for location A under geometric mean scenario that were moderately contaminated. The trend reported for both scenarios has some similarity with the work of Bhutiani et al. (2017), Izah et al. (2017c). From the result of contamination factor and negative geo-accumulation index it suggests that instances of the heavy metals contamination in the sediment of the river is from anthropogenic sources (Izah et al., 2017c).
|
Table 5 Geo-accumulation index of the heavy metals concentration in sediment of Nun River at Gbarantoru and Tombia towns in Bayelsa state, Nigeria |
.png)
Table 6 presents the quantification of contamination (QoC) of heavy metals in sediment of Nun River in Bayelsa state, Nigeria. In location A, all the heavy metals under study showed positive quantification values in both background scenarios. Furthermore, in median mean consideration, all the quantification of contamination was 0.000% for location B, and positive for geometric mean scenario. Location C showed negative quantification of contamination except for cobalt that was 0.000% under both considerations. The positive values result suggests that pollution/contamination in the study locations are due to anthropogenic sources (Bhutiani et al., 2017; Izah et al., 2017c). The difference among the various locations suggests variation in the anthropogenic activities in each of the locations. This trend has also been reported by Bhutiani et al. (2017), Izah et al. (2017c).
.png) Table 6 Quantification of contamination (%) of heavy metals concentration in sediment of Nun River at Gbarantoru and Tombia towns in Bayelsa state, Nigeria |
Table 7 presents the ecological risk (ER) and ecological risk index (R’) of heavy metals in sediment of Nun river in Bayelsa state, Nigeria. The ecological risk index were within low risk (ER < 40) except for cadmium in location A and B which was within moderate risk (Er 40 ≤ Er < 80) under geometric mean consideration. The higher ecological risk of cadmium in this study could be due to the higher toxic factor (Zhu et al., 2012; Ghaleno et al., 2015; Izah et al., 2018). Typically, cadmium has no known biological activity on living things; as such its presence in living organisms could be detrimental to the living organisms even at low concentration (Ghaleno et al., 2015; Izah et al., 2016; 2018). The ecological risk index showed low risk (R’<150) of heavy metals in all the locations. This suggests that on the overall, concentration of heavy metals in the sediment may not be able to cause any major shift in the sediment balance.
|
Table 7 Ecological risk of the heavy metal concentration in sediment of Nun River at Gbarantoru and Tombia towns in Bayelsa state, Nigeria |
.png)
3 Conclusions
In coastal region of Bayelsa state, several water bodies exist and are called by different names including creeklets, creeks, streams, rivers, ponds, lakes etc. In Bayelsa state, Nun River is a major water systems that bifurcate through the area and emptied into the ocean through the estuaries. At different locations most of the rivers have different names depending on the community. The river system is a major recipients of municipal wastes stream in the area. Furthermore, several anthropogenic activities are carried out in the shores of the river system. This study assessed the environmental risk level of heavy metal in sediment of Nun River in Bayelsa state. The results showed that there was significant variation (P<0.05) among the various locations. Positive significant correlations also exist between the heavy metals. Environmental risk indices showed low to moderate contamination (contamination factor, degree of contamination and pollution load index), un-contamination to moderate contamination (index of geo-accumulation), and low ecological risk. Positive quantification of contamination values reveals pollution due to anthropogenic activities. Therefore, there is the need to effectively manage activities leading to increased sediment heavy metals in Nun River system in Bayelsa state, Nigeria.
Author’s contributions
OAA conceived the idea and carried out the experimental design. FAM carried the sampling, laboratory analysis and managed the literature search. SCI carried out the statistical analysis. FAM and SCI involved in draft manuscript preparation. OAA corrected the tenses in the manuscript. All authors read and approved the final manuscript.
Agedah E.C., Ineyougha E.R., Izah S.C., and Orutugu L.A., 2015, Enumeration of total heterotrophic bacteria and some physico-chemical characteristics of surface water used for drinking sources in Wilberforce Island, Nigeria, Journal of Environmental Treatment Techniques, 3(1): 28-34
Aghoghovwia O.A., Miri F.A., and Izah S.C., 2018, Impacts of Anthropogenic Activities on Heavy Metal Levels in Surface Water of Nun River around Gbarantoru and Tombia Towns, Bayelsa State, Nigeria, Annals of Ecology and Environmental Science, 2(2): 1-8
Aghoghovwia O.A., Oyelese O.A., and Ohimain E.I., 2015, Heavy metal levels in water and sediment of Warri River, Niger Delta, Nigeria, International Journal of Geology, Agriculture and Environmental Sciences, 3(1): 20-24
Angaye T.C.N., Zige D.V., and Izah S.C., 2015, Microbial load and heavy metals properties of leachates from solid wastes dumpsites in the Niger Delta, Nigeria, Journal of Environmental Treatment Techniques, 3(3): 175-180
Asaah V.A., Abimbola A.F., and Suh C.E., 2006, Heavy metal concentrations and distribution in surface soils of the Bassa industrial zone 1, Douala, Cameroon, Arabian Journal of Science and Engineering, 31(2): 147-158
Ben-Eledo V.N., Kigigha L.T., Izah S.C., and Eledo B.O., 2017a, Water quality assessment of Epie creek in Yenagoa metropolis, Bayelsa state, Nigeria, Archives of Current Research International, 8(2): 1-24
https://doi.org/10.9734/ACRI/2017/34504
Ben-Eledo V.N., Kigigha L.T., Izah S.C., and Eledo B.O., 2017b, Bacteriological Quality Assessment of Epie Creek, Niger Delta Region of Nigeria, International Journal of Ecotoxicology and Ecobiology, (3): 102-108
Bhutiani R., Kulkarni D.B., Khanna D.R., and Gautam A., 2017, Geochemical distribution and environmental risk assessment of heavy metals in groundwater of an industrial area and its surroundings, Haridwar, India, Energy, Ecology and Environment, 2(2): 155-167
https://doi.org/10.1007/s40974-016-0019-6
El-Metwally M.E.A., Madkour A.G., Fouad R.R., Mohamedein L.I., Nour Eldine H.A., Dar M.A., and El-Moselhy Kh.M., 2017, Assessment the leachable heavy metals and ecological risk in the surface sediments inside the Red Sea ports of Egypt, International Journal of Marine Science, 7(23): 214-228
https://doi.org/10.5376/ijms.2017.07.0023
Gasiorek M., Kowalska J., Mazurek R., and Pajak M., 2017, Comprehensive assessment of heavy metal pollution in topsoil of historical urban park on an example of the Planty Park in Krakow (Poland), Chemosphere, 179: 148-158
https://doi.org/10.1016/j.chemosphere.2017.03.106
PMid: 28365500
Ghaleno O.R., Sayadi M.H., and Rezaei M.R., 2015, Potential ecological risk assessment of heavy metals in sediments of water reservoir case study: Chah Nimeh of Sistan, Proceedings of the International Academy of Ecology and Environmental Sciences, 5(4): 89-96
Hakanson L., 1980, An ecological risk index for aquatic pollution control, A sedimentological approach, Water Research, 14: 975-1001
https://doi.org/10.1016/0043-1354(80)90143-8
Hammer Ø., Harper D.A.T., Ryan P.D., 2001, PAST: Paleontological statistics software package for education and data analysis, Palaeontologia Electronica 4(1): 9pp
Hassaan M.A., Nemr A.E., and Madkour F.F., 2016, Environmental Assessment of Heavy Metal Pollution and Human Health Risk, American Journal of Water Science and Engineering, 2(3): 14-19
Idris M.A., Kolo B.G., Garba S.T., and Waziri I., 2013, Pharmaceutical Industrial Effluent: Heavy Metal Contamination of Surface water in Minna, Niger State, Nigeria, Bulletin of Environmental Pharmacology and Life Science, 2(3): 40-44
Inengite A.K., Oforka N.C., and Osuji L.C., 2010, Survey of heavy metals in sediments of Kolo creek in the Niger Delta, Nigeria, African Journal of Environmental Science and Technology, 4(9): 558-566
Izah S.C., Bassey S.E., and Ohimain E.I., 2018, Ecological risk assessment of heavy metals in cassava mill effluents contaminated soil in a rural community in the Niger Delta Region of Nigeria, Molecular Soil Biology, 9(1): 1-11
https://doi.org/10.5376/msb.2018.09.0001
Izah S.C., Inyang I.R., Angaye T.C.N., and Okowa I.P., 2017a, A review of heavy metal concentration and potential health implications in beverages consumed in Nigeria, Toxics, 5(1): 1-15
https://doi.org/10.3390/toxics5010001
PMid: 29051433 PMCid:PMC5606672
Izah S.C., Bassey S.E., and Ohimain E.I., 2017b, Assessment of heavy metal in cassava mill effluent contaminated soil in a rural community in the Niger Delta region of Nigeria, EC Pharmacology and Toxicology, 4(5): 186-201
Izah S.C., Bassey S.E., and Ohimain E.I., 2017c, Geo-accumulation index, enrichment factor and quantification of contamination of heavy metals in soil receiving cassava mill effluents in a rural community in the Niger Delta region of Nigeria, Molecular Soil Biology, 8(2): 7-20
https://doi.org/10.5376/msb.2017.08.0002
Izah S.C., Bassey S.E., and Ohimain E.I., 2017d, Assessment of pollution load indices of heavy metals in cassava mill effluents contaminated soil: a case study of small-scale cassava processing mills in a rural community of the Niger Delta region of Nigeria, Bioscience Methods, 8(1): 1-17
https://doi.org/10.5376/bm.2017.08.0001
Izah S.C., Chakrabarty N., and Srivastav A.L., 2016, A Review on Heavy Metal Concentration in Potable Water Sources in Nigeria: Human Health Effects and Mitigating Measures, Exposure and Health, 8: 285-304
https://doi.org/10.1007/s12403-016-0195-9
Izah S.C., and Angaye T.C.N., 2016a, Heavy metal concentration in fishes from surface water in Nigeria: Potential sources of pollutants and mitigation measures, Sky Journal of Biochemistry Research, 5(4): 31-47
Izah S.C., and Angaye T.C.N., 2016b, Ecology of Human Schistosomiasis intermediate host and Plant Molluscicides used for control: A review. Sky Journal of Biochemistry Research, 5(6): 075- 082
Izah S.C., Angaye T.C.N., and Ohimain E.I., 2015, Climate change: some meteorological indicators and perception of farmers in Yenagoa metropolis, Bayelsa state, Nigeria. International Journal of Geology, Agriculture and Environmental Sciences, 3(1): 56-60
Kigigha L.T., Seiyaboh E.I., Obua V.J., and Izah S.C., 2018, Contamination of River Nun at Amassoma, Bayelsa State, Nigeria Due to Microbial Diversity in Sediments, Environmental Toxicology Studies Journal, 2(1): 2
Kowalska J., Mazurek R., Ga˛siorek M., Setlak M., Zaleski T., and Waroszewski J., 2016, Soil pollution indices conditioned by medieval metallurgical activity - a case study from Krakow (Poland), Environmental Pollution, 218: 1023-1036
https://doi.org/10.1016/j.envpol.2016.08.053
PMid: 27574802
Mazurek R., Kowalska J., Gasiorek M., Zadrozny P., Jozefowska A., Zaleski T., Kepka W., Tymczuk M., and Orłowska K., 2017, Assessment of heavy metals contamination in surface layers of Roztocze National Park forest soils (SE Poland) by indices of pollution, Chemosphere, 168: 839-850
https://doi.org/10.1016/j.chemosphere.2016.10.126
Monakhov S., Esina O., Monakhova G., and Tatarnikov V., 2015, Environmental quality assessment: geoenvironmental indices, In: Environmental indicators, Armon R.H., and Hanninen O. (eds), Springer, Dordrecht
https://doi.org/10.1007/978-94-017-9499-2_27
Muller G., 1969, Index of geo-accumulation in sediments of the Rhine River, GeoJournal, 2(3):108–118
Ogamba E.N., Izah S.C., and Oribu T., 2015a, Water quality and proximate analysis of Eichhornia crassipes from River Nun, Amassoma Axis, Nigeria, Research Journal of Phytomedicine, 1(1): 43 -48
Ogamba E.N., Izah S.C., and Toikumo B.P., 2015b, Water quality and levels of lead and mercury in Eichhornia crassipes from a tidal creek receiving abattoir effluent, in the Niger Delta, Nigeria. Continental Journal of Environmental Science, 9(1), 13-25
Ogamba E.N., Seiyaboh E.I., Izah S.C., Ogbugo I., and Demedongha F.K., 2015c, Water quality, phytochemistry and proximate constituents of Eichhornia crassipes from Kolo creek, Niger Delta, Nigeria. International Journal of Applied Research and Technology, 4(9): 77-84
Ogamba E.N., Ebere N., and Izah S.C., 2017a, Levels of lead and cadmium in the bone and muscle tissues of Oreochromis niloticus and Clarias camerunensis, EC Nutrition, 7(3): 117-123
Ogamba E.N., Ebere N., and Izah S.C., 2017b, Heavy Metal Concentration in Water, Sediment and Tissues of Eichhornia crassipes from Kolo Creek, Niger Delta, Greener Journal of Environment Management and Public Safety, 6(1): 001-005
Ohimain E.I., Jonathan G., and Abah S.O., 2008, Variations in Heavy Metal Concentrations Following the Dredging of an Oil Well Access Canal in the Niger Delta, Advances in Biological Research, 2 (5-6): 97-103
Seiyaboh E.I., and Izah S.C., 2017a, Review of Impact of Anthropogenic Activities in Surface Water Resources in the Niger Delta region of Nigeria: A case of Bayelsa state, International Journal of Ecotoxicology and Ecobiology, 2(2): 61-73
Seiyaboh E.I., and Izah S.C., 2017b, Bacteriological assessment of a tidal creek receiving slaughterhouse wastes in Bayelsa state, Nigeria, Journal of Advances in Biology and Biotechnology, 14(1): 1-7
https://doi.org/10.9734/JABB/2017/34593
Seiyaboh E.I., Izah S.C., and Bokolo J.E., 2017a, Bacteriological quality of water from river nun at Amassoma Axises, Niger Delta, Nigeria, ASIO Journal of Microbiology, Food Science & Biotechnological Innovations, 3(1): 22-26
Seiyaboh E.I., Izah S.C., and Oweibi S., 2017b, Assessment of Water quality from Sagbama Creek, Niger Delta, Nigeria, Biotechnological Research, 3(1): 20-24
Seiyaboh E.I., Izah S.C., and Oweibi S., 2017c, Physico-chemical Characteristics of Sediment from Sagbama Creek, Nigeria, Biotechnological Research, 3(1): 25-28
Seiyaboh E.I., Inyang I.R., and Izah S.C., 2016a, Spatial Variation in Physico-chemical Characteristics of Sediment from Epie Creek, Bayelsa State, Nigeria, Greener Journal of Environment Management and Public Safety, 5(5): 100-105
https://doi.org/10.15580/GJEMPS.2016.5.121616214
Seiyaboh E.I., Inyang I.R., and Izah S.C., 2016b, Seasonal Variation of Physico-Chemical Quality of Sediment from Ikoli Creek, Niger Delta, International Journal of Innovative Environmental Studies Research, 4(4): 29-34
Singovszka E., Balintova M., and Holub M., 2014, Assessment of Heavy Metals Concentration in Sediments by Potential Ecological Risk Index, Journal of the Polish Mineral Engineering Society, No volume: 137-140
Soliman N.F., Nasr S.M., and Okbah M.A., 2015, Potential ecological risk of heavy metals in sediments from the Mediterranean coast, Egypt, Journal of Environmental Health Science and Engineering, 13: 70
https://doi.org/10.1186/s40201-015-0223-x
PMid:26457189 PMCid:PMC4600254
Swarnalatha K., Letha J., and Ayoob S., 2013, Ecological risk assessment of a tropical lake system, Journal of Urban and Environmental Engineering, 7(2): 323-329
https://doi.org/10.4090/juee.2013.v7n2.323329
Thambavani S.D., and Uma Mageswari Utsr., 2013, Metal pollution assessment in ground water. Bulletin of Environmental Pharmacology Life Science, 2(12): 122–129
Todorova Y., Lincheva S., Yotinov I., and Topalova Y., 2016, Contamination and Ecological Risk Assessment of Long-Term Polluted Sediments with Heavy Metals in Small Hydropower Cascade, Water Resource Management, 30: 4171–4184
https://doi.org/10.1007/s11269-016-1413-8
Tomlinson D., Wilson J., Harris C., and Jeffrey D., 1980, Problems in the assessment of heavy-metal levels in estuaries and the formation of a pollution index, Helgolander Meeresunters, 33: 566–575
https://doi.org/10.1007/BF02414780
Xu Z.Q., Ni S. J., and Tuo X.G., 2008, Calculation of heavy metals toxicity coefficient in the evaluation of potential ecological risk index, Environmental Science and Technology, 31: 112-115
Zhu H., Yuan X., Zeng G., Jiang M., Liang J., Zhang C., Yin J., Huang H., Liu Z., and Jiang H., 2012, Ecological risk assessment of heavy metals in sediments of Xiawan Port based on modified potential ecological risk index, Transactions of Nonferrous Metals Society of China, 22: 1470-1477


. PDF(306KB)
. FPDF(win)
. HTML
. Online fPDF
Associated material
. Readers' comments
Other articles by authors
. Ogaga Augustine Aghoghovwia
. Sylvester Chibueze Izah
. Faith Ayakpo Miri
Related articles
. Anthropogenic activities
. Contamination
. Ecological risk assessment
. Nun River
Tools
. Email to a friend
. Post a comment