Research Report
Development of a Liquid-Phase Chip for Rice Functional Genes 
 ,
Lexin Yang1,2 ,
Yanling Wen1,2 ,
Jianhong Xu1,2
,
Lexin Yang1,2 ,
Yanling Wen1,2 ,
Jianhong Xu1,2  ,
Zhen Liu1,2
,
Zhen Liu1,2 2 Department of Agronomy, College of Agriculture & Biotechnology, Zhejiang University, Hangzhou, 310058, China
Author Correspondence author
Bioscience Methods, 2026, Vol. 17, No. 4 doi: 10.5376/bm.2026.17.0018
Received: 15 Jun., 2026 Accepted: 16 Jul., 2026 Published: 28 Jul., 2026
Zeng H.D., Yang L.X., Wen Y.L., Xu J.H., and Liu Z., 2026, Development of a liquid-phase chip for rice functional genes, Bioscience Methods, 17(4): 231-258 (doi: 10.5376/bm.2026.17.0018)
Liquid-phase chip utilizes genomic capture sequencing to genotype target loci, offering advantages such as high throughput, low cost, and high customizability. Rice research and breeding often require large-scale cultivars detection. This study aimed to develop an accurate, efficient, high-throughput, and low-cost liquid-phase detection chip targeting important functional genes reported in rice. Through literature review, we collected 76 previously reported important functional genes in rice and identified 122 functional natural variation sites within them. These genes primarily control agronomic traits of great interest to breeders, including yield, quality, fertility, biotic and abiotic stress resistance, and nutrient use efficiency. Specific hybridization probes were designed targeting these functional variation loci, leading to the development of the 0.1K rice functional gene chip (RFG 0.1K). To evaluate the performance of this chip, we used it to genotype 35 diverse rice accessions (including indica, japonica, and Aus). The results showed that the call rate for each sample exceeded 90%, the Q30 value for all samples was above 80%, the biological replicate consistency reached 97%, and the accuracy verified by Sanger sequencing was 88%, indicating that the genotyping results of this chip are accurate, reliable, and reproducible. Subsequently, based on the high-quality genotyping results, population genetic analyses were further conducted. The results demonstrated that this chip can effectively distinguish the genetic backgrounds of different rice accessions, showing good application value in rice germplasm resource identification and molecular-assisted breeding.
1 Introduction
Rice (Oryza sativa L.) is a staple food crop for 3.5 billion people worldwide. In-depth dissection of the regulatory mechanisms underlying rice agronomic traits is crucial for ensuring global food security. Thanks to the rapid development of molecular biology techniques, researchers have identified over 3,000 functional genes associated with agronomic traits in rice, among which the regulatory mechanisms and functional variation sites of some genes have been clearly elucidated (Li et al., 2018; Yang et al., 2024). For example, the rice cold sensor COLD1 reported by Academician Kang Chong's team at the Institute of Botany, Chinese Academy of Sciences, revealed that polymorphisms in functional nucleotides of COLD1 lead to differences in cold tolerance among rice subspecies (Ma et al., 2015). Shen Rongxin and Wang Haiyang's team discovered that six nucleotide differences in the OsMYB8 promoter between indica and japonica subspecies result in differences in flowering habits between the subspecies (Gou et al., 2024). These studies indicate that modern breeding has entered an era of precision, where the regulation of rice phenotypes has reached the single nucleotide level.
The fruitful achievements in rice functional gene research have further promoted the application of marker-assisted selection (MAS) technology in breeding. MAS is a method that facilitates selection in breeding by analyzing molecular markers tightly linked to target genes, thereby improving breeding efficiency, shortening the breeding cycle, and accelerating the breeding process (Asif et al., 2024). To date, various molecular marker detection technologies based on genomic genetic variations (such as SNPs and InDels) have been developed (Hasan et al., 2021) including Kompetitive Allele Specific PCR (KASP) (He et al., 2014), Gene chip (Lenoir et al., 2006), Genotyping By Sequencing (GBS) (Elshire et al., 2011), High Resolution Melting (HRM) (Wang et al., 2015), and others. These technologies offer advantages such as time and labor savings, high throughput, a large number of markers, wide distribution, and high accuracy, and have been successfully applied to gene discovery, genetic diversity analysis, germplasm resource identification, and many other areas (Sun et al., 2018; Anglin et al., 2024; Liu et al., 2025). However, these technologies also have different drawbacks. For example, traditional solid-phase gene chips have poor flexibility, as their probe design depends on known SNP sites and it is difficult to integrate newly discovered molecular markers, leading to high costs and long cycles for chip updates. Later-developed GBS requires whole-genome sequencing, which is expensive and results in a large amount of redundant data waste. With the trend toward increasing precision in scientific research, genotyping technologies require more accurate technical approaches. Thus, the liquid-phase chip, i.e., genotyping by target sequencing (GBTS), has emerged. It not only has relatively lower cost but also overcomes the poor flexibility and difficult update challenges of traditional solid-phase chips.
Among the developed rice gene chips, the number of liquid-phase chips is relatively small, and the reported chips are mostly used for population genetic analysis, with few directly linked to functional genes regulating traits. This creates a gap that makes it difficult to directly apply molecular research advances to breeding practice. To address this, this project aims to develop an accurate, efficient, high-throughput, and low-cost liquid-phase detection chip based on target-site capture sequencing technology, targeting important functional genes reported in rice, suitable for large-scale sample detection in the breeding process.
2 Materials and Methods
2.1 Development of the rice functional gene liquid-phase chip
2.1.1 Collection of functional variation sites in genes controlling important agronomic traits in rice
Collection of functional variation sites: Using "Natural variation" and "Functional SNP" as core search keywords, a systematic search was conducted in academic literature databases including the X-MOL academic platform (https://www.x-mol.com/) and Web of Science (https://webofscience.clarivate.cn/). Additionally, the online website National Rice Data Center (https://www.ricedata.cn/) was used to obtain a list of reported functional genes in rice, and relevant literature was traced. Based on the comprehensive literature review results (Supplementary Table 1), the target functional sites were screened according to the following two criteria:
(1) The SNP/InDel reported in the literature represents a variation resulting from natural evolution within populations, rather than an artificially induced mutation;
(2) The variation has been experimentally verified to have a significant effect on a specific phenotype or biological function in rice.
Extraction of flanking sequences of functional variation sites: Based on the Nipponbare reference genome (IRGSP-1.0 / MSU Release 7.0), the physical position of each functional site on the rice chromosome was determined according to literature reports. The gene containing the functional site was retrieved from the Phytozome database (https://phytozome-next.jgi.doe.gov/), and the sequence of the functional site along with 100 bp upstream and downstream was extracted. All sequences were saved in Excel format, recording information such as gene name and chromosomal physical position for subsequent probe design.
2.1.2 Population frequency analysis of functional variation loci
To evaluate the effectiveness of the collected functional variation sites for chip development, population frequency analysis was performed using the rice database RiceVarMap v2.0 (https://ricevarmap.ncpgr.cn/). For a single functional site, the "Search for Variation information by Variation ID" and "Search for Variation by Region" functions were used. By inputting the chromosomal position, the population frequency of the site was queried across 4,636 rice varieties, including 2,759 indica, 1,512 japonica, 269 Aus, and 96 aromatic rice accessions.

2.1.3 Probe synthesis for the rice functional gene chip
Specific hybridization probes targeting the functional variation sites were designed using GenoBaits Probe Designer software.
2.2 Genotyping and population genetic analysis
2.2.1 Rice materials
A total of 35 rice cultivated varieties (cultivars) available in the laboratory were selected as the test materials (Table 1). These materials originated from different countries, and their genetic backgrounds cover the major subspecies of rice, including indica, japonica, and Aus (Table 2). All materials were used for subsequent genotyping using the RFG 0.1K liquid-phase chip.
|
Table 1 Information of 35 rice cultivars |
.png)
|
Table 2 Subpopulations of 35 rice cultivars |
.png)
2.2.2 Genotyping based on the RFG 0.1K chip
The test materials were planted in the experimental field of the Hainan Research Base of Zhejiang University in Sanya, Hainan Province. At the peak tillering stage (two months after planting, from December 6 to February 1 of the following year), healthy leaves free from pests and diseases were collected for genotyping. To evaluate the stability and reproducibility of the chip, three individual plants of the L31 variety were randomly selected, and their leaves were collected as biological replicates. Genotyping results were obtained through DNA extraction, GenoBaits targeted capture library construction, quality inspection of the GenoBaits targeted capture library, and high-throughput sequencing.
2.2.3 Validation of chip accuracy
Leaf DNA from L01, L10, L13, L14, L20, L23, and L62 was extracted using the TPS method as templates. Five loci from the chip were selected for primer design (Table 3). After PCR amplification, the purity and integrity of the target products were examined using 1% agarose gel electrophoresis. The PCR products were then subjected to Sanger sequencing.
|
Table 3 Primer sequences for chip accuracy validation |
.png)
2.2.4 Genetic diversity analysis
The RFG 0.1K chip contained a total of 122 functional markers. During the processing of genotyping data, to ensure marker independence and the accuracy of subsequent genetic analyses, the raw data were filtered and integrated, ultimately yielding 100 high-quality effective markers. The genotyping results were imported into RStudio (v2025.09.2), and statistical analysis was performed on the genotyping dataset of the 100 markers using the R language. The test materials were divided into indica, japonica, and Aus subpopulations, and the major allele frequency, polymorphism information content (PIC), observed heterozygosity (Ho), and expected heterozygosity (He) were calculated for each subpopulation. During the analysis, missing genotypes due to insufficient sequencing depth were excluded from the statistical calculations.
The formula for calculating the polymorphism information content (PIC) is as follows:

pij represents the frequency of the *j*-th allele variant at the *i*-th locus.
2.2.5 Population structure and phylogenetic analysis
To investigate the population genetic structure of the 35 rice accessions, a Bayesian model‑based clustering analysis was performed using Structure (v2.3.4). Because loci with a polymorphism information content of zero do not contribute to genetic structure analysis, monomorphic loci with PIC = 0 were removed (Supplementary Table 2), ultimately retaining the genotyping results of 68 markers for population genetic structure analysis. After the calculations, the output files for each K value (files ending with "_f") were compressed into ZIP files and uploaded to the online service platform StructureSelector (https://lmme.ac.cn/StructureSelector/) to calculate the optimal number of subpopulations (ΔK value). This platform calculates ΔK based on Evanno's method to determine the optimal number of subpopulations and calls CLUMPAK (Kopelman et al., 2015) to integrate and align the results from multiple runs, generating a consensus Q matrix. Subsequently, stacked bar charts were drawn in GraphPad Prism (v10.1.2) based on the consensus Q matrices for K = 2, 3, and 4.
To further validate the ability of the genotyping results from the chip to reflect population genetic structure and to reveal the genetic relationships among varieties, the genotype files of the 35 rice materials at 100 loci were converted into FASTA format. A phylogenetic tree was constructed using MEGA (v11.0.13) software based on the neighbor-joining method. The Tamura‑Nei model was selected, and the support for each branch was evaluated using 1,000 bootstrap replicates to obtain preliminary clustering results. After exporting the results, the tree was visualized using the online tool iTOL (https://itol.embl.de/).
3 Results
3.1 Development of the rice functional gene liquid-phase chip
3.1.1 Functional variation sites of genes controlling physiology and important agronomic traits in rice
In this study, a total of 76 key genes controlling rice physiology and important agronomic traits were collected and organized, comprising 122 functional SNP and InDel sites. Through literature review, it was confirmed that these variations are directly associated with function. Based on the specific traits they control, the 76 genes were classified into eight categories: 4 genes for physiological traits, 14 for plant morphology, 6 for growth period, 20 for grain and yield, 2 for eating and cooking quality, 3 for biotic stress, 24 for abiotic stress, and 3 for comprehensive functions (Table 4, Figure 1A). Furthermore, among the collected genes, some contain only a single functional site, while others (e.g., OsDEP1, TIG1) harbor multiple functional sites, reflecting the complexity of natural variation in functional genes. The "comprehensive" functional genes (Table 4) are involved in regulating two or more categories of traits simultaneously, exhibiting typical pleiotropy. For example, variation in OsSTP28 affects rice nitrogen use efficiency, tillering ability, and yield; OsMADS56 is involved in regulating grain weight, plant height, and heading date; and qPSR10 plays a dual role in rice cold tolerance and grain shape formation.
|
Table 4 Confirmed key genes controlling important agronomic traits in rice |
.png)
|
Figure 1 Characteristic features of the rice functional gene chip Note: A. The traits associated with 122 loci and 76 genes on the rice functional gene chip; B. Mutation types in gene chip markers |
.png)
The 122 functional variation sites comprised 31 InDels and 91 SNPs (Figure 1B). The 91 SNPs consisted of six types of base substitutions, including 29 [C/T] variants (accounting for 23.8% of the total), 27 [A/G] variants, 13 [G/T] variants, 10 [A/C] variants, 7 [C/G] variants, and 5 [A/T] variants (Figure 3.1B). Among these, transition types (C/T and A/G) together accounted for 61.5% of the total SNPs, significantly higher than the other four transversion types, indicating a clear nucleotide substitution bias. The functional variation sites collected in this study were distributed across the 12 chromosomes of rice (Figure 2).
|
Figure 2 Density distribution of gene chip markers (122 SNPs/InDels) across 12 chromosomes Note: The x-axis represents the physical distance along the chromosomes (in Mb), and the y-axis represents the different chromosomes (Chr1-Chr12). The color gradient reflects the number of functional sites (SNPs/InDels) within a 1 Mb window. The lightest gray areas indicate windows with no sites (density of 0). The color transitions from light gray to pure black, representing a gradual increase in the number of sites in the region. The specific numerical range corresponds to the legend scale shown in the lower right corner |
.png)
3.1.2 Population frequency analysis of functional variation sites in rice
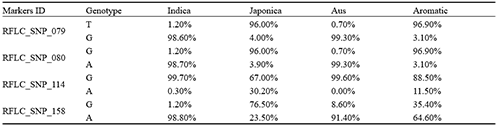
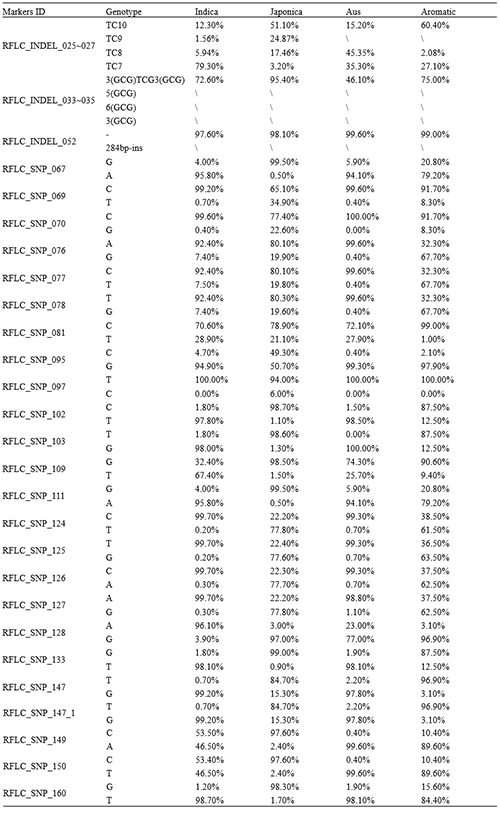
To evaluate the effectiveness of the collected functional variation sites, clarify their ability to distinguish different allelic genotypes within the same subspecies, and reveal the distribution characteristics of these sites across different subspecies, population frequency analysis was performed on the collected functional variation sites according to functional categories (Table 4) (Supplementary Tables 3.1-3.7), aiming to provide a reference for the subsequent screening of materials for chip genotyping. Based on database retrieval, population frequency analysis results were obtained for 79 sites, i.e., the distribution frequencies of different allelic genotypes in indica, japonica, Aus, and aromatic rice subspecies.
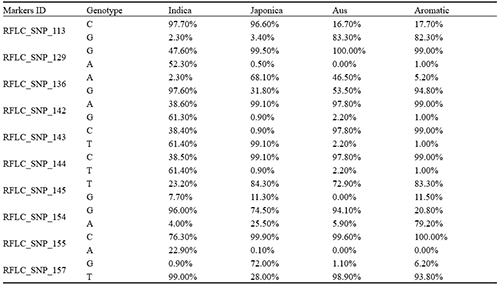
Some sites exhibited a "one-sided" distribution pattern in specific rice subspecies. For example, at the RFLC_SNP_129 site (Table 5), only the homozygous genotype G was present in Aus rice, with allele A completely absent; however, both alleles G and A were widely distributed in indica rice. This analysis result suggests that, after excluding the effect of genetic background, different genotypes at this site within the indica population are highly likely to have a significant impact on tiller number. Based on the above discussion, the subsequent strategy for material selection and phenotypic determination follows these guidelines: when selecting materials for genotyping, the candidate population should cover the major subspecies of cultivated rice (e.g., indica, japonica, and Aus rice), and each subspecies should include at least five representative accessions to ensure sufficient genetic variation within each subspecies, allowing for comparison and facilitating statistical analysis.
|
Table 5 Population frequency analysis of plant morphology functional loci |
.png)
3.2 Population genetic analysis of 35 rice materials
3.2.1 Genotyping results based on the RFG 0.1K chip
The genotyping results of the RFG 0.1K chip for the 35 rice cultivated varieties showed (Table 6) that, among the 100 functional gene markers, the call rate for each sample ranged from 93% to 100%, meaning that each sample yielded valid genotyping results at more than 93% of the marker loci. The Q30 value for all samples was ≥80%, indicating good sequencing quality, and thus the detection results were of high quality. These metrics confirmed that the chip's detection results are highly reliable. Further analysis of three biological replicate samples of the L31 variety showed that they had identical genotypes at 97 marker loci, with a consistency rate of 97%, demonstrating good reproducibility of the chip. In summary, the genotyping results of the RFG 0.1K chip are reliable and sufficient to meet the requirements for subsequent genetic analysis and breeding applications.
|
Table 6 RFG0.1K genotyping call rate |
.png)
To verify the genotyping accuracy of the RFG 0.1K chip, five loci were randomly selected, and Sanger sequencing primers were designed using the Nipponbare reference genome as the template. Seven rice DNA samples were randomly selected as templates for PCR amplification (Figure 3). During the amplification process, the target products for L20 at the RFLC_SNP_071 locus and for L01 at the RFLC_SNP_109 locus were not obtained. This may be due to unknown polymorphisms (such as single nucleotide variants or small deletions) in the primer binding regions of these two test materials, which prevented effective primer annealing. Therefore, these two missing data points were excluded from subsequent accuracy statistics. For the remaining varieties, specific single fragments were obtained at each validation locus.
|
Figure 3 PCR results for the accuracy validation of the RFG0.1K Note: A. Amplification result of locus RFLC_SNP_071; B. Amplification results of loci RFLC_SNP_083 and RFLC_SNP_084; C. Amplification results of loci RFLC_SNP_086 and RFLC_SNP_109. The locus ID and the expected target fragment size are indicated above each gel image. The numbers above the lanes (e.g., L01, L62) denote the template samples used for amplification. M represents the DNA molecular weight marker. Nip is the amplification product of Nipponbare at this locus, serving as a reference Unlabeled lanes were not loaded with sample |
.jpg)
The alignment results showed that among a total of 33 valid genotyping data points, 29 loci showed complete consistency between chip genotyping (Table 7), inconsistent loci indicated in bold red) and Sanger sequencing (Figure 4, Figure 5), giving an overall genotyping accuracy of 88%. In-depth analysis of the discordant loci revealed that chip genotyping errors exhibited significant variety specificity and genotype dependence. For L13, a cultivated indica rice from China, chip genotyping results at two out of five validation loci were inconsistent with Sanger sequencing. Furthermore, discrepancies between chip and sequencing were observed in the identification of heterozygous sites: at the RFLC_SNP_083 locus of L01, the chip genotyping showed a homozygous genotype, whereas Sanger sequencing revealed a heterozygous genotype (double peaks). In summary, despite a certain proportion of genotyping deviations in some varieties (e.g., L13) and complex genomic regions, the RFG 0.1K functional marker chip maintained high genotyping accuracy in most cultivated rice materials, demonstrating its practical value for rice germplasm resource identification and marker-assisted selection breeding.
|
Table 7 RFG0.1K genotyping results of selected tested rice varieties |
.png)
|
Figure 4 Sanger sequencing results for chip accuracy validation Note: Each column represents the sequencing chromatograms of the same locus (RFLC_SNP_071, 083, 084, 086, 109) across different rice samples. Different rows indicate different tested rice materials (L01, L10, L13). The top sequence with a blue background represents the Nipponbare reference genome sequence. The red boxes highlight the positions of the target SNP loci and the actual sequenced bases |
.png)
|
Figure 5 Sanger sequencing results for chip accuracy validation Note: Each column represents the sequencing chromatograms of the same locus (RFLC_SNP_071, 083, 084, 086, 109) across different rice samples. Different rows indicate different tested rice materials (L14, L20, L23, L62). The top sequence with a blue background represents the Nipponbare reference genome sequence. The red boxes highlight the positions of the target SNP loci and the actual sequenced bases. The blank area indicates that no valid sequencing data was obtained for that material at the specific locus |
.png)
3.2.2 Population genetic diversity analysis
Genetic diversity analysis was performed on 35 rice varieties using 100 functional markers (Table 8). The results showed that the observed heterozygosity (Ho) of the overall tested population ranged from 0 to 0.400, with an average of 0.0386; the expected heterozygosity (He) ranged from 0 to 0.512, with an average of 0.2388; and the polymorphism information content (PIC) ranged from 0 to 0.412, with an average of 0.1908. Among these, 48 markers (48%) had PIC > 0.25, indicating moderate polymorphism, while the remaining 52% of markers exhibited low polymorphism. This phenomenon may be attributed to the fact that the selected loci are mostly located within known functional genes or their promoter regions. During long-term natural evolution and artificial domestication, advantageous alleles regulating important agronomic traits are often subject to directional selection pressure. Therefore, compared with non-functional variants, markers within functional genes tend to show lower genetic diversity, which is consistent with previous studies (Cong et al., 2016).
|
Table 8 Genetic diversity index of 35 rice cultivars |
.png)
The test materials were divided into three subspecies: indica (19 accessions), japonica (11 accessions), and Aus (5 accessions). The polymorphism information content for the 100 marker loci was calculated for each subspecies (Figure 6), and the average values were computed (Table 7). The results showed that the japonica subspecies had the highest genetic diversity (Ho = 0.0646, He = 0.1844, PIC = 0.1500), followed by indica (Ho = 0.0301, He = 0.1356, PIC = 0.1081), and Aus had the lowest (Ho = 0.0165, He = 0.1089, PIC = 0.0887). This result may be related to the genetic backgrounds of each subspecies as well as the number of accessions.
|
Figure 6 Distribution of polymorphic information content (PIC) of functional markers among different rice subpopulations Note: The different shaded blocks represent the number of markers within various PIC intervals. The black blocks (NA) indicate loci where PIC values could not be calculated due to missing genotyping data |
.png)
Furthermore, the observed heterozygosity in all three subspecies was significantly lower than the expected heterozygosity (Ho < He), which is consistent with the genetic characteristics of self-pollinating crops such as rice, i.e., a higher proportion of homozygous individuals and a lower proportion of heterozygous individuals at the same locus (Li et al., 2011). This phenomenon also suggests the possible existence of further substructure within each subspecies (Wahlund effect), meaning that there is macro-geographic isolation or pedigree stratification among different varieties within the same subspecies (De Meeûs, 2018). At the overall level, the overall He (0.2388) of the 35 test materials was higher than the average values of each subspecies, further confirming the impact of inter-subspecies genetic differentiation on diversity parameters (Garnier‐Géré et al., 2013).
3.2.3 Population structure analysis
TheΔK value was calculated based on the Structure analysis results (Figure 8). At K = 2, the highest peak of ΔK (ΔK = 265.92) was observed, indicating that the 35 rice accessions could be divided into two major subspecies at the fundamental evolutionary level (Figure 7). Subspecies I (green) contained 23 rice varieties, covering all indica accessions (L01, L02, etc.) as well as some Aus accessions (L04, L22, L25, L55); subspecies II (orange) contained 12 varieties, covering all japonica accessions (L05, L07, etc.) and one Aus accession (L28). This division clearly reflected the subspecies differentiation between indica and japonica, which was largely consistent with the prior classification information of the test varieties (Table 2).
|
Figure 7 Population genetic structure of 35 cultivated rice accessions based on Structure analysis (K = 2, 3, 4) Note: The y-axis represents the estimated proportion of an individual's genome originating from each inferred ancestral population (Q value). The x-axis indicates the accession numbers of the tested rice varieties (L01-L62). Each variety is represented by a single vertical bar, with the lengths of the colored segments indicating the proportions of different inferred ancestral clusters |
.png)
|
Figure 8 Line chart of ΔK values across different K values for the 35 rice varieties Note: The y-axis represents the ΔK calculated based on the Evanno method. The x-axis represents the assumed number of ancestral clusters (K). The highest peak of ΔK occurs at K=2, indicating the optimal number of subpopulations is two |
.png)
Furthermore, a secondary peak of ΔK (ΔK = 7.94) was observed at K = 3, revealing a finer genetic structure within the test population. Within subspecies I, four Aus accessions (L04, L22, L25, L28) and the indica accession L18 were assigned to subspecies III (blue), further distinguishing indica from Aus. This finding aligns with the classical understanding of rice population genetics, namely that although Aus is closely related to indica in terms of genetic affinity, it possesses a relatively independent evolutionary origin and distinct population characteristics, constituting a unique subspecies. Further analysis revealed that at K = 3, some varieties (L04, L05, L07, L28, L57) exhibited clear mixed genetic backgrounds, i.e., the maximum Q value corresponding to a single ancestral population did not reach a significantly dominant level, and the bar plots for these varieties showed a multi-color mixed distribution. This suggests that the test materials have experienced hybridization and introgression between different subspecies during their breeding history, consistent with the expectation of gene flow between subspecies. In summary, the RFG 0.1K chip not only provides accurate and reliable genotyping data that effectively reflect the fundamental genetic backgrounds of different rice varieties but also exhibits good sensitivity in detecting complex genetic backgrounds.
3.2.4 Population phylogenetic analysis
A phylogenetic tree was constructed using MEGA (v11.0.13) based on the neighbor-joining method. The clustering analysis results (Figure 9) showed that the 35 rice varieties were clearly divided into three major phylogenetic clades. The overall topology not only corresponded to the prior classification of indica and japonica but also highly matched the Structure analysis results (Figure 7), further revealing fine-scale genetic relationships among the varieties.
|
Figure 9 Phylogenetic tree of 35 rice accessions constructed using the neighbor-joining (NJ) method Note: Numbers at branch nodes indicate bootstrap support values based on 1,000 replicates (only values >40% are shown). The scale bar (0.1) in the upper left corner represents genetic distance. Different evolutionary clades are distinguished by colors: the red clade represents clade I (24 accessions), the black clade represents clade II (9 accessions), and the blue clade represents clade Ⅲ (2 accessions) |
.png)
Clade I (red) was the largest group, containing 24 varieties. This group mainly consisted of the 19 indica varieties, 4 Aus varieties (L04, L22, L25, L55), and 1 japonica variety (L57), which was similar to the grouping at the optimal K value (K = 2) in the Structure analysis. In terms of geographical origin, this clade encompassed indica varieties widely distributed across South Asia, Southeast Asia, and China (e.g., IR64a, 9311, Minghui63), as well as four Aus varieties originating from South Asia (India, Bangladesh, Sri Lanka). The close genetic relationship between indica and Aus, clustering together in one group, is consistent with the genetic background of rice populations. The japonica variety L57 clustered within this group, suggesting that it may have a complex breeding history or possible introgression from indica, a speculation supported by its mixed ancestral components in the Structure analysis (Figure 7).
Clade II (black) contained nine varieties, all of which were japonica varieties (including L05, L08, L09, L10, L12, L19, L26, L29, L62). The close genetic relationships among these varieties suggest that they may share similar breeding histories or genetic origins, representing a japonica group with relatively homogeneous genetic backgrounds.
Clade III (blue) had the most distinctive composition, containing only two varieties: the japonica variety L07 and the Aus variety L28. These two varieties did not cluster with other varieties of their respective subspecies but instead formed a separate small branch. This result may be explained by the following reasons: first, these two varieties may carry certain rare alleles at the selected functional marker loci, or possess unique genetic combinations across different functional markers, making them genetically more distant from other varieties; second, these varieties may have experienced introgression events in their history that could not be fully captured by this population structure analysis.
4 Discussion
Through literature retrieval and systematic review, a total of 122 natural variation sites from 76 rice functional genes were collected, and the rice liquid‑phase chip RFG 0.1K was developed. Genotyping was performed on 35 cultivated rice varieties (including indica, japonica and Aus). Based on the genotyping results, population diversity and genetic structure analyses were further conducted. The results indicate that this chip has high application potential in rice germplasm resource identification and molecular breeding.
4.1 Comparison of RFG 0.1K with mainstream technologies such as KASP, WGS and GBS
In recent years, marker‑assisted selection (MAS) has been widely applied in crop improvement. However, the cost and technical barriers of genotyping have long been key bottlenecks limiting the large‑scale implementation of molecular breeding in practice. Xu Yunbi et al. systematically summarized the development history of genotyping technologies and pointed out that genotyping has transitioned to the fourth generation (4G) - from high‑cost solid‑phase chips and random sequencing‑based genotyping (GBS) to targeted sequencing‑based (GBTS) liquid‑phase chips (Xu et al., 2020). The RFG 0.1K liquid‑phase chip was developed precisely within this 4G technology framework.
Compared with low‑throughput technologies represented by KASP, liquid‑phase chips have obvious advantages in parallel detection of multiple markers. KASP, based on allele‑specific PCR and a fluorescence reporting system, can meet low‑ to medium‑throughput genotyping needs, but each reaction typically detects only one or a few SNPs. When breeding requires simultaneous detection of tens or even hundreds of functional markers, the per‑marker cost of KASP increases multiplicatively. In contrast, GBTS can detect hundreds to thousands of marker loci in parallel in a single sequencing run, significantly reducing the average cost per marker. At the same time, GBTS offers greater flexibility than solid‑phase chips: probes on solid‑phase chips are fixed on a solid substrate, making it difficult to add or replace new markers once the chip is designed, whereas GBTS, based on liquid‑phase probe capture, allows flexible adjustment of marker sets by replacing probe combinations, thereby reducing the cost and cycle of chip updates. Compared with genotyping‑by‑sequencing (GBS), GBTS uses fixed and uniform markers, facilitating data comparison and integration across different laboratories and batches. From the perspective of marker detection efficiency, GBTS can detect multiple SNPs within a single amplicon (the mSNP strategy), greatly improving the efficiency of detecting variation within target loci. Compared with GBS and solid‑phase chips, GBTS offers multiple advantages including platform adaptability, marker flexibility, detection efficiency, data additivity, support convenience, and broad applicability. Furthermore, GBTS can generate marker panels of different densities by adjusting sequencing depth, meeting the needs of various application scenarios (Guo et al., 2019; Guo et al., 2021).
From the cost perspective of whole‑genome sequencing (WGS), although WGS provides the most comprehensive information on genomic variation, its high sequencing cost, data processing and storage costs make it difficult to promote on a large scale in routine breeding workflows. GBTS sequences only target regions, significantly reducing sequencing costs while meeting throughput requirements for marker coverage. Therefore, RFG 0.1K, with a marker density of 0.1K, focuses on known functional sites of already cloned functional genes, achieving high‑throughput parallel detection of key functional sites for breeding at a manageable cost.
In summary, RFG 0.1K has a clear positioning in terms of technical approach: it strikes a balance between KASP and WGS - it offers the advantage of parallel detection of multiple markers compared with KASP, and significant cost advantages compared with WGS, while retaining the high flexibility of the GBTS technology platform. This chip is particularly suitable for rapid screening of core functional gene loci in early generations of breeding, providing breeders with a molecular detection tool that is "usable, affordable, and effective."
4.2 Comparison of RFG 0.1K with existing rice liquid‑phase chip products
Several rice liquid‑phase chips have been developed in China, among which the most representative include Huazhi Biotechnology's "Daoxiang No. 1" (60K), Hubei Province's "Daogongxin No. 1" (225 functional gene loci), and Sichuan Province's "Tianfu Daoxin No. 1" (5K, more than 50 functional gene loci). RFG 0.1K and these products have different focuses in terms of positioning and technical approaches.
"Daoxiang No. 1" is a 60K high‑density cGPS liquid‑phase breeding chip developed based on resequencing data of 3,024 rice accessions from 89 countries and regions, covering 62,027 SNP sites, with an average call rate of 99.56%, a genotype consistency rate of 99.95% for replicate samples, and an average coverage of 99.8%. Characterized by high‑density whole‑genome coverage, this chip is suitable for large‑scale genomic scanning applications such as germplasm resource identification and genetic diversity assessment. In contrast, RFG 0.1K focuses on 122 functional variation sites from reported functional genes, not pursuing maximization of marker number but targeting functional sites, directly serving key trait improvement in molecular marker‑assisted breeding. The two are complementary: high‑density chips are suitable for whole‑genome scanning and discovery of unknown loci, while RFG 0.1K is suitable for high‑throughput screening of known functional sites.
"Daogongxin No. 1," based on multiplex PCR and next‑generation sequencing technology, integrates the latest research findings in rice functional genomics from both domestic and international sources, enabling one‑time detection of 225 functional gene loci related to yield, quality, and resistance, reducing detection cost from the traditional 600 RMB to below 80 RMB. RFG 0.1K also focuses on functional gene loci, but with greater emphasis on systematic literature curation, detailing the gene structure (promoter region/exon region/5′UTR), allelic types, and phenotypic effects for each locus, providing breeders with searchable locus‑trait association information. It is distinctive in the systematic collection and information completeness of functional loci. Moreover, the chip allows for subsequent probe supplementation and improvement, and the cost per rice sample for genotyping using RFG 0.1K is 38 RMB.
"Tianfu Daoxin No. 1" is the first 5K liquid‑phase chip for rice in Sichuan Province, incorporating more than 5,000 genetic markers and enabling one‑time detection of more than 50 important functional gene loci for over 10 key breeding traits, suitable for germplasm resource identification, material background screening, genomic selection, and targeted improvement. The marker density (5K) of this chip is significantly higher than that of RFG 0.1K (0.1K), but the number of functional loci (more than 50) is similar to RFG 0.1K's 76 functional genes and 122 functional sites. RFG 0.1K has an advantage in the breadth of functional gene coverage and focuses more on functional variation sites with clearly defined phenotypic effects, enabling accurate genotyping of target loci.
Overall, RFG 0.1K does not aim to maximize marker density but adopts a "less but refined" strategy, focusing on known functional sites of already cloned functional genes. Its core advantages lie in three aspects: first, the functional certainty of the loci - all loci have been reported in the literature to be directly associated with specific phenotypes, reducing the risk of false positives in association analysis; second, the systematic nature of locus information - it records in detail the gene structure position, allelic types, and phenotypic effects of each locus, providing direct reference for breeders' material selection and marker‑assisted decision making; third, cost control - the detection cost can be further reduced while ensuring accuracy. It is worth noting that this chip, together with products such as "Daogongxin No. 1," are all independently developed domestically in terms of intellectual property, collectively forming a domestic camp of rice breeding chips, which helps break foreign technical barriers in the field of genotyping.
A limitation of this study is the low marker density of the chip, covering only 122 effective markers, which is insufficient to support application scenarios requiring high‑density markers, such as genome‑wide association studies (GWAS) and genomic selection (GS). In addition, the polymorphism of some functional sites on the chip within the Aus subspecies is less than 30%, limiting the power of association analysis within this subspecies. Future efforts could consider combining this chip with high‑density chips - first using RFG 0.1K for rapid screening of core functional sites, then using high‑density chips for fine‑scale dissection of target materials, forming a hierarchical detection strategy that combines functional sites and genome‑wide markers, thereby better balancing cost and accuracy.
Conflict of interest
The authors declare no conflict of interest.
Acknowledgments
This work was supported by the Project of Sanya Yazhou Bay Science and Technology City (SCKJ-JYRC-2023-60), and Hainan Provincial ‘Nanhai NewStar’ Science and Technology Innovation Platform Project (NHXXRCXM-202362).
Anglin N.L., Chavez O., Soto-Torres J., Gomez R., Panta A., Vollmer R., Durand M., Meza C., Azevedo V., Manrique-Carpintero N.C., Kauth P., Coombs J.J., Douches D.S., and Ellis D., 2024, Promiscuous potato: elucidating genetic identity and the complex genetic relationships of a cultivated potato germplasm collection, Frontiers in Plant Science, 15: 1341788.
Asif A.K., Iqbal B., Jalal A., Khan K.A., Al-Andal A., Khan I., Suboktagin S., Qayum A., and Elboughdiri N., 2024, Advanced molecular approaches for improving crop yield and quality: A review, Journal of Plant Growth Regulation, 43(7): 2091-2103.
https://doi.org/10.1007/s00344-024-11253-7
Cong X.H., Shi F.Z., Ruan X.M., Zhang X.Z., and Luo Z.X., 2016, Analysis of genetic diversity of 62 indica rice parents from Southeast Asia based on microsatellite marker, Journal of Nuclear Agricultural Sciences, 30(5): 859-868.
De Meeûs T., 2018, Revisiting FIS, FST, Wahlund effects, and null alleles, Journal of Heredity, 109(4): 446-456.
https://doi.org/10.1093/jhered/esx106
Elshire R.J., Glaubitz J.C., Sun Q., Poland J.A., Kawamoto K., Buckler E.S., and Mitchell S.E., 2011, A robust, simple genotyping-by-sequencing (GBS) approach for high diversity species, PLoS ONE, 6(5): e19379.
https://doi.org/10.1371/journal.pone.0019379
Garnier-Géré P., and Chikhi L., 2013, Population subdivision, Hardy-Weinberg equilibrium and the Wahlund effect, in Balding D.J., Moltke I., and Marioni J.C. (eds.), Handbook of Statistical Genomics, Chichester: John Wiley & Sons, Ltd.
https://doi.org/10.1002/9780470015902.a0005446.pub3
Gou Y.J., Heng Y.Q., Ding W.Y., Xu C., Tan Q., Li Y., Fang Y., Li X., Zhou D., Zhu X., Zhang M., Ye R., Wang H., and Shen R., 2024, Natural variation in OsMYB8 confers diurnal floret opening time divergence between indica and japonica subspecies, Nature Communications, 15(1): 2262.
https://doi.org/10.1038/s41467-024-46579-z
Guo Z.F., Wang H.W., Tao J.J., Ren Y.H., Xu C., Wu K.S., Zou C., Zhang J.N., and Xu Y.B., 2019, Development of multiple SNP marker panels affordable to breeders through genotyping by target sequencing (GBTS) in maize, Molecular Breeding, 39(3): 37.
https://doi.org/10.1007/s11032-019-0940-4
Guo Z.F., Yang Q.N., Huang F.F., Zheng H.J., Sang Z.Q., Xu Y.F., Zhang C., Wu K.S., Tao J.J., Prasanna B.M., Olsen M.S., Wang Y.B., Zhang J.n., and Xu Y.B., 2021, Development of high-resolution multiple-SNP arrays for genetic analyses and molecular breeding through genotyping by target sequencing and liquid chip, Plant Communications, 2(6): 100230.
https://doi.org/10.1016/j.xplc.2021.100230
Hasan N., Choudhary S., Naaz N., Sharma N., and Laskar R.A., 2021, Recent advancements in molecular marker-assisted selection and applications in plant breeding programmes, Journal of Genetic Engineering and Biotechnology, 19(1): 128.
https://doi.org/10.1186/s43141-021-00231-1
He C.L., Holme J., and Anthony J., 2014, SNP genotyping: the KASP assay, in Fleury D. and Whitford R. (eds.), Crop breeding: methods and protocols, New York: Springer, pp.75-86.
https://doi.org/10.1007/978-1-4939-0446-4_7
Lenoir T., and Giannella E., 2006, The emergence and diffusion of DNA microarray technology, Journal of Biomedical Discovery and Collaboration, 1(1): 11.
https://doi.org/10.1186/1747-5333-1-11
Li S.K., Jiang C., Wang J.Y., 2011, Genetic diversity of Oryza rufipogon Griff. in Zhangpu County of Fujian Province by using SSR markers, Journal of Plant Genetic Resources, 12(1): 75-79, 85.
10.13430/j.cnki.jpgr.2011.01.015.
Li Y., Xiao J.H., Chen L.L., Huang X.H., Cheng Z.K., Han B., Zhang Q.F., Wu C.Y., and Wang S.P., 2018, Rice functional genomics research: past decade and future, Molecular Plant, 11(3): 359-380.
https://doi.org/10.1016/j.molp.2018.01.007
Liu D.D., Zhang C.Y., Ye Y.Y., Wang X.Q., Li S.Q., Chen J.F., Zhao Y., Wang H., and Li Z.G., 2025, TEA5K: A high-resolution and liquid-phase multiple-SNP array for molecular breeding in tea plant, Journal of Nanobiotechnology, 23(1): 481.
https://doi.org/10.1186/s12951-025-03533-5
Ma Y., Dai X.Y., Xu Y.Y., Yang Z., Chen H., Zhang J., Zhang Q., and He Z., 2015, COLD1 confers chilling tolerance in rice, Cell, 160(6): 1209-1221.
https://doi.org/10.1016/j.cell.2015.01.046
Sun Z.W., Li H.L., Zhang Y., Wang J., Zhang X., and Zhang H., 2018, Identification of SNPs and candidate genes associated with salt tolerance at the seedling stage in cotton (Gossypium hirsutum L.), Frontiers in Plant Science, 9: 1011.
https://doi.org/10.3389/fpls.2018.01011
Wang D.M., Li J., Yang H.M., Zhang Y., Liu Y., and Zhang H., 2015, Application of high resolution melting curve in SNP detection, Genomics and Applied Biology, 34(4): 892-895.
Xu Y.B., Yang Q.N., Zheng H.J., Xu Y.F., Sang Z.Q., Guo Z.F., Peng H., Zhang C., Lan H.F., Wang Y.B., Wu K.S., Tao J.J., and Zhang J.N., 2020, Genotyping by target sequencing (GBTS) and its applications, Scientia Agricultura Sinica, 53(15): 2983-3004.
https://doi.org/10.3864/j.issn.0578-1752.2020.15.001
Yang X.Y., Yu S.C., Yan S., Wang Y., Zhang T., Li H., Chen J., and Zhang Q., 2024, Progress in rice breeding based on genomic research, Genes, 15(5): 564.
https://doi.org/10.3390/genes15050564
|
Supplementary Table 1 References for 76 genes controlling rice physiology and agronomic traits |
.png)
|
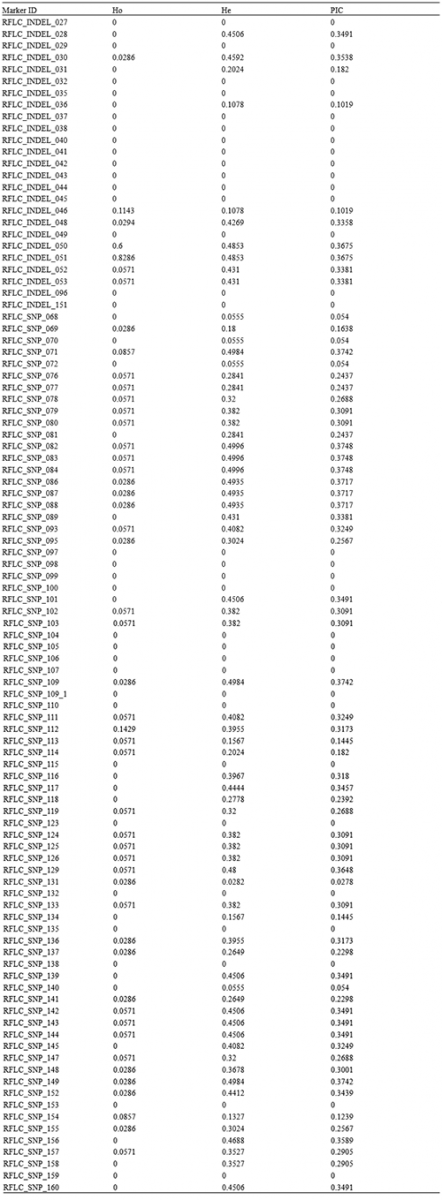
Supplementary Table 2 Population Diversity Analysis of Each Locus |
|
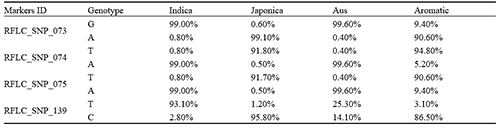
Supplementary Table 3.1 Population frequency analysis of physiological trait loci |
|
Supplementary Table 3.2 Population frequency analysis of plant morphology functional loci |
|
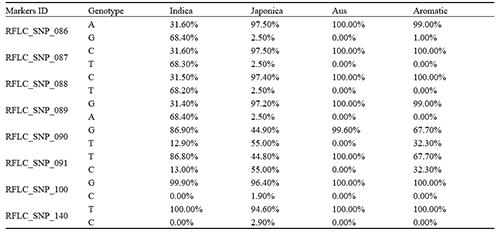
Supplementary Table 3.3 Population frequency analysis of growth period functional loci |
|
Supplementary Table 3.4 Population frequency analysis of grain and yield functional loci |
.png)
|
Supplementary Table 3.5 Population frequency analysis of eating quality and comprehensive functional loci |
|
Supplementary Table 3.6 Population frequency analysis of biotic stress functional loci |

|
Supplementary Table 3.7 Population frequency analysis of abiotic stress functional loci |




. PDF(0KB)
. HTML
Associated material
. Readers' comments
Other articles by authors
. Haodan Zeng

. Lexin Yang
. Yanling Wen
. Jianhong Xu
. Zhen Liu
Related articles
. Rice
. Functional genes
. Liquid-phase chip
. Molecular marker
. Genotyping
Tools
. Email to a friend
. Post a comment