Research Article
Fermentation: A Means of Treating and Improving the Nutrition Content of Cassava (Manihot esculenta C.) Peels and Reducing Its Cyanide Content 
 Author
  Correspondence author
Genomics and Applied Biology, 2017, Vol. 8, No. 3 doi: 10.5376/gab.2017.08.0003
Received: 01 Sep., 2016 Accepted: 14 Sep., 2016 Published: 30 Jun., 2017
Salami O.S., Akomolafe O.M., and Olufemi-salami F.K, 2017, Fermentation: a means of treating and improving the nutrition content of cassava (Manihot esculenta C.) peels and reducing its cyanide content, Genomics and Applied Biology, 8(3): 16-24 (doi: 10.5376/gab.2017.08.0003)
The capability of microorganisms involved in the fermentation and detoxification of cassava peels through the breaking down of cyanogenic glucosides as well as improving protein and oil contents of fermented milled underwatered cassava peels were studied at ambient temperature and relative humidity of 28 ± 2°C and 75 ± 5% respectively. Corynebacterial manihot, Lactobacillus plantarum, Sacharomyces exiguus and Geotrichum candidum were isolated from cassava waste water. Standard analytical methods were used to monitor the fermentation for linamarin breakdown and free (residual) cyanide production. Linamarin decreased with increase in fermentation time and the lowest value of linamarin was observed at 96 hours by the mixed microbes of bacteria and yeasts {20.11 mg HCN/kg}. Residual cyanide increased during fermentation; however, no ordered pattern in the increase. Total titratable acidity increased with increase in time of fermentation. The mash fermented by Lactobacillus plantarum had the highest values of titratable acidity of 2.23 % at the end of fermentation, while their pH values reduced with increase in fermentation period. Protein content of mash fermented by Lactobacillus plantarum and naturally fermented peels had the highest value of 21.60 mg/g/dry matter. The carbohydrate content of the Lactobacillus plantarum fermented mash was lower than the values (48.13 mg/g/dry matter) obtained from the mashes fermented by other isolates. Fermentation reduced cyanide content of milled cassava peels and also improve the protein and oil contents of it.
Background
Cassava (Manihot esculenta Crantz) has been considered as a major staple food in the developing world, providing a basic diet for about 500 million people. It is the fifth most cultivated and important plant in the world (FAOSTAT, 2011) has been processed into different valuables such as garri, tapioca, starch, ethanol etc. (IITA, 1999). The major problem associated with cassava as food is it cyanide content which exists as cyanogenic glycosides, primarily known as linamarin (Uyoh et al., 2007). More than 50% of the cyanide present in the root is concentrated in the peels (Burns et al., 2012). Peeling is considered as one of the post harvest practices employed in reducing cyanide in cassava roots (Okigbo et al., 2009). However, the peel of cassava which is usually peeled off during processing to reduce the cyanide content of the tuber constitutes a huge of waste. Exploiting this waste for other benefit is a major concern which has not been well scrutinized, although, several research works have been done aimed at reducing cyanide in cassava, however, in this study, the cassava peels’ nutrients has been fully investigated to understand how fermentation can be used to reduce the cyanide content as well as improving the nutrient of the cassava peels.
1 Results
1.1 Identification of bacteria
The physiochemical test used for the identification of the bacteria isolated from the waste water of fermented cassava is shown on Table 1. Although the two bacteria types; Corynebacteria manihot and Lactobacillus plantarum isolated from the effluent were Gram positive and cocci-shaped bacteria, nevertheless, L. plantarum was differentiated form C. manihot by the inability of C. manihot to produce gas from these sugars: glucose, lactose and fructose during fermentation. The motility test also set a clear margin of identification between C. manihot and L. plantarum in that L. plantarum was motile whereas C. manihot was not.
|
Table 1 Tests for identification of bacteria Note: Summary of biochemical test used in identifying bacterial pure cultures obtained; Key: (+) Positive test, (-) Negative test |
.png)
1.2 Fungi identification
The other microorganisms isolated from the effluents were non filamentous fungi; Geotrichum candidum and Sacharomyces exguus. The fungi were differentiated by considering their shapes and spore type. G. candidun produces condidiospores as S. exguus produces buds.
1.3 Linamarin (mgHCN/Kg) valu1es obtained during fermentation of wet cassava peels
Linamarin which is the cyanogenic glucoside present in the cassava peels decreased as the time of fermentation increased in all the treatments including the control experiment. The highest and the lowest values of linamarin were recorded in 0h and 96h of fermentation in all the treatments and control experiment respectively. The control experiment had the least amount of linamarin value of 247.66 mgHCN/Kg whereas the highest linamarin value of 317.86 mgHCN/Kg was observed in the G. candidum treatment at the beginning of fermentation.
At 24 hours of fermentation, the control experiment had the least amount of linamarin value of 91.23 mgHCN/Kg while the highest value of 190.56 mgHCN/Kg was recorded in C. manihot’s treatment. Decrease in linamarin occurs daily in all the treatments. At 72 hours of fermentation L. plantarum, G. candidum, and S.exguuss’ treatments had linamarin values of 53.53, 53.33 and 51.00 mgHCN/Kg which were not significantly different by Tukey’s Test at P < 0.05. Nevertheless, these linamarin values (53.53, 53.33 and 80.03 mgHCN/Kg) obtain from L. plantarum, G. candidum, and S.exguuss’ treatments at 72 hours of fermentation were significantly different from the linamarin values of 20.11, 77.56 and 80.03 mgHCN/Kg obtained from the mixed microbes, the control experiment and C. manihot’s treatments respectively. After 72h of fermentation, the highest linamarin value of 80.03 mgHCN/Kg was recorded in C. manihot’s treatment whereas; the lowest value of linamarin was 20.11 mgHCN/Kg was recorded in the mixed culture treatment (Table 2).
|
Table 2 Linamarin (mgHCN/Kg) values obtained during fermentation of milled cassava peels Note: Each value is Means ± Standard deviation of three replicates. Values followed by the same letter in the same column are not significantly different using Tukey’s Test at *(P < 0.05) |
.png)
The rates of fermentation were observed to be faster in the treatments than the control when the linamarin values obtained between 0 and 96 h of fermentation were compared. Nevertheless, no significant difference was observed in the mean value of linamarin among all the treatments and control experiments at 96 hours of fermentation by Tukey’s Test at P < 0.05 (Table 2).
1.4 Residual cyanide (mgHCN/kg) obtained during fermentation of milled cassava peels
The residual cyanide which is the quantity of liberated cyanide from the linamarin increased as the days of fermentation increased in all the treatments and control experiment. Nevertheless, this was not the case at 96 hours of fermentation: the residual cyanide decreased in all the treatments except the mixed culture treatment which had a slight increment from 59.77 mgHCN/kg to 60.33 mgHCN/kg. S. exguus had the least residual cyanide of 55.90 mgHCN/kg while L. plantarum had the highest value (of linamarin) of 57.87 mgHCN/kg at the onset of fermentation. Notwithstanding, no significant difference was noted in the mean values of residual cyanide of all the treatments and control at the commencement of fermentation when Tukey’s mean separation test at P < 0.05 confidence level was used to separate the mean value. At 96 hours of fermentation, the least value of residual cyanide of 59.77 mgHCN/kg was recorded in the control experiment whereas the highest value was observed in the L. plantarum treatment (Table 3).
|
Table 3 Residual cyanide (mgHCN/kg) obtained during fermentation of milled cassava peels Note: Each value is Means ± Standard deviation of three replicates. Values in the same column are not significantly different using Tukey’s Test at * (P < 0.05) |
.png)
1.5 Total titratable acidity obtained during fermentation of milled cassava peels
The result of the titratable acidity (TA) is shown on Table 4. The TA increases as the period of fermentation increases. At the beginning of fermentation, G. candidum had the highest amount of TA which was 6.80%. This value (6.80%) is significantly different (P < 0.05) from the TA produced by other treatments and control experiment all at the onset of fermentation. Moreover, the control experiment, L. plantarum and the mixed microbes’ treatments did not show any significant difference (P < 0.05) in TAs of 0.58% and 0.52% respectively produced at the point of inoculation, but they were significantly different from TA of 0.68% and 0.52% respectively produced by G. candidum and L. plantarum’s treatments. It was also observed that TA increased more rapidly between 0 and 24 hours. The highest increment in TA (0.42 to 0.88%) between 0 and 24 hours of fermentation was recorded in the S. exguu’s treatments which was 47.73% increment. More so, at 24 hours of fermentation, mixed microbes treatment produced the lowest TA of 0.58%. At 48h of fermentation, Control, L. plantarum and mixed microbes’ treatments produces TAs of 1.3, 1.3 and 1.22% respectively although these values were not significantly different from each other at P < 0.05.
|
Table 4 Total titratable acidity obtained during fermentation of milled cassava peels Note: Each value is Means ± Standard deviation of three replicates. Values followed by the same letter in the same column are not significantly different using Tukey’s Test at * (P < 0.05) |
.png)
At 72 hours of fermentation, all the treatment except control and mixed culture showed significant differences in the amount of TA produced. L. plantarum treatment produced the highest TA of 22.20 % at this instance (72 hours of fermentation). At 96 hours of fermentation, C. manihot produced the least amount of TA, 12.20 % which was significantly different from the TAs produced by all the other treatments, however, L. plantarum’s treatment produced the highest amount of TA of 22.26 % (Table 4).
1.6 pH of fermented milled cassava peels
The result of the pH of the fermented cassava on Table 5 reveals that the pH of the fermented cassava peels decreases as period of fermentation increases in all the treatments and control experiment. The control experiment had a pH of 8.90 which was the highest observed at the beginning of fermentation while the least pH at the same instant of time was recorded in the cassava peels treated with by S .exguus. At 96 h of fermentation, the pH value C. manihot, S. exguus and mixed microbes’ treatments showed no significant difference at P < 0.05. Nevertheless, the highest pH of 5.97 was recorded in the mixed microbes’ treatment while the lowest pH of 5.40 was recorded in G. candidum’s treatment.
|
Table 5 Daily pH of fermented of milled cassava peels Note: Each value is Means ± Standard deviation of three replicates. Values followed by the same letter in the same column are not significantly different using Tukey’s Test at * (P < 0.05) |
.png)
1.7 Proximate analysis of the milled cassava peels before and after fermentation
The result of the proximate analysis of the cassava peels before and after fermentation is shown on Table 6. The percentage carbohydrate in all the treatments including the control experiment decreased after 96 hours of fermentation. The lowest percentage of carbohydrate of 48.13% was recorded in L. plantarum’s treatment while the highest percentage of carbohydrate (54.48%) after treatment was observed in G.candidum’s treatment. The percentage protein in all the treatments increased but the highest percentage protein content after 96 hours of fermentation (26.83 ± 0.01) was recorded in L. plantarum’s treatment while the lowest percentage of carbohydrate (23.31) was recorded in G. candidum’s treatment.
|
Table 6 Proximate analysis of wet cassava peels before and after 96 hours fermentation Note: Each value is Means ± Standard deviation of three replicates. Values followed by the same letter in the same column are not significantly different using Tukey’s Test at * (P < 0.05); NB: The control represents the proximate analysis of the un-inoculate wet peels after 96 hours |
.png)
All the fermenting organisms (treatments) used for the fermentation of the milled cassava peels caused increase in the protein content of the peels after 96 hours of fermentation, and the percentage values of protein after 96 hours of fermentation, were significantly different from the initial percentage protein content of the wet cassava peels before fermentation. However, significant differences were also shown among treatments in their percentage protein after 96 hours of fermentation. The highest and lowest percentages of protein after 96 hours of fermentation (26.86 and 23.31%) were recorded in the L. plantarum and G. candidum treatment respectively.
The percentage oil content result shows that the initial oil content before fermentation was lower than the oil contents of all the treatments and control experiment after the fermentation period elapses. The highest and lowest oil contents of 19.87 and 17.84 % were recorded in the L. plantarum and S. exguus’s treatments. More so, there were significant differences among the treatment.
The ash content of the control experiment (4.43) was higher than those of the treatments after fermntation. Mixed microbes treatment produced the least amount of ash of 1.79 which not significantly different from the ash content of the G. candidum’s treatments after 96h of fermentation. The highest and lowest fibre contents of 4.14 and 1.80 were observed in the control experiment of the control experiment and G. candidum’s treatment respectively (Table 6).
2 Discussion
The results of this research showed that Lactobacillus plantarum, Corynebacterium manihot, Geotricum candidum and Saccharomyces exguus were the common microorganisms responsible for the fermentation of cassava. These microorganisms (L. plantarum, C. manihot, G. candidum and S. exguus) isolated from the waste water of fermented cassava pulps have been earlier isolated by various researchers (Okafor, 1977; Essers et al., 1995; Amao-Awua et al., 1996; Kobawala et al., 2005). Moreover, these bacteria (L. plantarum, and C. manihot) and yeasts (G. candidum and S. exguus) have been reported to be the main fermenting microorganisms of cassava (Ahaotu et al., 2013). All the microorganisms except Saccharomyces exguus, isolated and used for the study have been identified as linamarase (an enzyme capable of converting cyanogenic glucoside to free cyanide and glucose) producing microorganisms (Ahaotu et al., 2013). Kimaryo et al. (2000) and Oyewole and Odunfa (1990) have reported that linamarase produced by microorganisms contribute to the process of detoxification of cassava pulp during fermentation.
The result also showed that, after 96 hours of fermentation, the linamarin content of the fermented cassava peels was very low. Cardoso et al. (2005) reported that the combination of wetting, fermentation and drying can reduce cyanide contents up to 99%. The increase in residual cyanide in all the treatments as the period of fermentation increased showed that more cyanides were released by breaking down linamarin (cyanoglucoside) through the process of fermentation.
Also, fermenting cassava peels was noted to cause an increase in the titratable acidity of the peels. This however may be due to the increase in the lactic acid content of the fermented peels and the release of residual cyanide which is acidic in nature. Lactic acid has been reported to be produced during fermentation of cassava for garri production and it (lactic acid) amount has been taken as an index of garri quality and it (lactic acid) content is dependent on the period of fermentation of the garri (Achinewhu and Owuamanam, 2001).
The decrease in the pH values of all the treatments was an indication that more acid was released or produced in the process of fermentation. This can be traced to the nature of the isolates used for the fermentation. Several researchers have been reported that these microbial isolates can thrive well in acidic media, especially when pH is not less than 4 (Abba-kareem and Okagbue, 1999; Oboh, 2005). The rapid degradation of the linamarin may also be facilitated by the indigenous enzymes; linamarase which has been reported to be concentrated at the peels of the cassava tuber (Kojima et al., 1983). More so, the pH range recorded during the experiment might have added the optimum activity of the enzymes. Owuamanam et al. (2010) and Yeoh (1989) have earlier reported a maximum activity of 85% for linamarase at pH between 8 and 5.
The study has shown that cassava peels (waste) is rich in protein, this may be linked to the fact that linamarase is protein in nature and it is more at the peels than the pulp of the cassava tuber (Kojima et al., 1983). Fermenting cassava peels increased the crude protein present in the cassava peels. The high protein content of the control after the period of fermentation is an indication that activity of the cassava peels’ enzymes. Although, the ability of the organisms to convert carbohydrate to protein during fermentation process may also contribute to the increase in the protein content as reported earlier (Gregory et al., 1976). The high protein values in the samples fermented by the isolates could also be as a result of the growth and multiplication of the microorganisms. Hence, the high amount of protein obtained from the proximate analysis of the cassava peels may be justified. However, the carbohydrate content of the raw cassava peels before fermentation was higher than the values obtained from the treatments, which validates the carbohydrate utilization of the fermenting microbes. The oil content of all the treatments were more than the initial oil content as it were in the case of crude protein, this may be due to the abundant availability of carbohydrate for energy production and the need for sourcing energy in other food material like oil may be useless. The high fibre content of the control experiment after fermentation may be due to the absence of fermenting organisms. This concurs with the findings of Srinorakutara et al. (2006) which revealed that soluble fibre is utilized by the organisms during fermentation.
Finally, since the crude protein and lipid content of the cassava peels after fermentation increased considerably, and cyanide content reduced significantly, hence, fermented cassava peels can be used as alternative source of protein for animals instead of discarding it as waste in cassava processing industries as it is done in Nigeria. More so, fermentation can be an essential way of improving the nutritional value of the peels.
3 Materials and Methodology
The cassava peels used for the study were obtained from Igbatoro cassava processing industry while the cassava was obtained from Agricultural Development Programme Farm, Akure, Ondo state Nigeria. The cassava peels were washed, drained and dipped in 70% ethanol for 5min. for surface sterilization. Working in a sterile top the peels were rapidly milled into a sterile container with a sterile Muchang grinder model No. 9FZ-300. The milled peels were then stored in a refrigerator at 4°C.
3.1 Microbial isolates
Microorganisms used for fermentation were isolated from liquid extract obtained from fermented cassava pulp in press at Igbatoro garri processing factory. One milliliter each of the extract was cultured separately on Potato Dextrose Agar (PDA) and Nutrient Agar (NA) prepared according to manufactural description. Pure cultures were obtained through sub culturing. The pure cultures were then identified and preserved in agar slant pending when they were needed.
3.2 Extraction of linamarase
Two hundred grams (200 g) of fresh cassava peels were homogenized in 1600 ml of 0.1 M acetate in a blender for 3 min. The homogenate was centrifuged at 10000 xg for 30 min. The supernatant liquid was brought to 60% saturation of (NH4)2SO4 by adding 724 g of (NH4)2SO4 in 1600 ml supernatant. The salt was added slowly with continuous gentle agitation. The precipitate was collected by centrifugation at 10000 rpm for 1h. The supernatant was discarded. The precipitate was dissolved in 150 ml of phosphate buffer (pH 6.0) and stored frozen.
3.3 Inoculation of milled cassava peels samples
Controlled fermentation was carried out using the method described by Okoli et al. (1992) with slight modification. Twenty grams of the milled cassava peels was weighed rapidly into three fermentation flasks of volume 250 ml that have been previously sterilized. The flasks containing the mesh were then inoculated with standardized cells suspension of Lactobacillus plantarum containing approximately 5.0 x 10⁵ cells/ml without dewatering the milled samples. The same procedure was repeated for the other isolates: Geotricum candidum, Saccharomyces exiguus and Corynebacterial manihot. A mixture of the various all the isolates containing approximately 5.0 x 10⁵ cells/ml was also used as inoculum to ferment the mash, in three different fermenting flasks. Three fermenting flasks was used for an inoculum per day, there for; a total of 45 fermenting flask was used for each organisms / treatment for the whole period of fermentation. The control experiment was also set up, mesh sample of mass twenty grams in forty-five flasks without any inoculum in them (three of the forty-five set up to be evaluated and discarded daily). The samples were left in the sterile incubator to ferment at ambient temperature (30 ± 2°C) and analysis for linamarin, free cyanide, titratable acidity and pH were taken daily while the proximate analysis were taken before and after the 96 hours of fermentation.
3.4 Preparation of standard KCN solution
This was prepared by dissolving 125 mg KCN in 0.2 M NaOH. This was then diluted 1: 100 using phosphate buffer (pH 6.0).
3.5 Preparation of blanks
Blanks used for the colorimetric procedure were prepared as follows. For the total cyanogens determination, 0.4 ml of phosphate buffer (pH 7.0) was mixed with 2.3 ml of phosphate buffer (pH 6.0), 0.1 ml of extraction medium and 0.6 ml of 0.2 M NaOH in a test tube and treated according to the colorimetric procedure.
For the glucosidic cyanogens (linamarin), 2.7 ml of phosphate buffer (pH 4.0) was mixed with 0.1 ml extraction medium, 0.6 ml of 0.2 M NaOH and 0.6 ml of KCN standard solution in a test tube.
For free cyanide 3.3 ml of phosphate buffer (pH 4.0), 0.1 ml extraction medium and 0.6 ml KCN standard solution were mixed together.
Cyanide content (mg HCNequiv/Kg) on dry weight basis was calculated using the expression below.
.jpg)
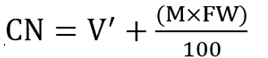
V = Volume of extraction medium
V' = Volume of adjusted to include sample moisture (ml)
A590 = Mean absorbance
Aequiv = Absorbance corresponding to 1 mgHCN
M = Moisture content (%); DW = Dry weight (g); FW = Fresh weight (g); CN = Cyanide content
3.6 Determination of cyanogens
The cyanogens were determined using modified O’Brien et al. (1991) method. Five grams of sample was homogenized in 20 ml of extraction medium (which {extracting medium} was previously prepared by adding 6.75 ml of H3PO4 to 200 ml of distilled water) for 15 sec. at low speed, then 2 min. at high speed with 1 min. rest in between periods. The sample was subsequently centrifuged for 10min. at 4000 rpm. The supernatant was collected for analysis for cyanogens (glucoside cyanogens) and residual cyanide (HCN).
3.7 Glucoside cyanogen’s (Linamarin) determination
From the extract, 0.1 ml pippeted and added to 0.4 ml of phosphate buffer (pH 7.0) in a stoppered test tube. Then 0.1 ml of linamarase enzyme was added and incubated for 15 min. at 30°C. Thereafter 0.6ml of 0.2 M NaOH was added and left for 5 min. after which, 2.5 ml of phosphate buffer (pH 6.0) was added. Subsequently, 0.2 ml of chloroamine T was added to the test tube already containing 4.0 ml of buffered extract to stabilize the colour formation. One mililitre of the mixture was introduced into the curvet of the spectrophotometer and ninhydrin of 0.5 ml was added to the mixture and the absorbance was immediately measured in the uv-photospectometer (UV-1100 Spectrophotometer Mapada model) at 590 nm wavelength (Mihaescu, 2009). The values were then calculated using the formula for calculating cyanide content described above.
3.8 Determination of residual cyanide
From the extract, 0.1 ml was pipetted and mixed with 3.9 ml of phosphate buffer (pH 4.0). Then the colorimetric procedure was used to determine the free cyanide content.
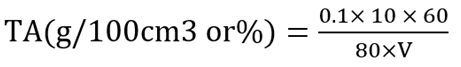
3.9 Determination titratable acidity
Ten grams of sample was homogenized in 200 ml of distilled water and filtered using Whatman filter paper. Eighty mililitre of filtrate was titrated with 0.1 M NaOH using 1% phenolphthalein as indicator (Obilie et al., 2004). The formula used in determining the Total Titratable Acidity is given as:
3.10 Determination of daily pH
Ten grams of the fermented peels was added to 20 ml of distilled water. Then the mixtures were stirred for 1 minute and the setups was left for 30 minutes, after which the pH of fermented peels were determined by dipping the tip of Jenway 3015 pH-meter into the suspension and the pH value of the fermented cassava read on the digital scale of the instrument.
Proximate Analysis was determined using AOAC (1990).
All the experimental set up were replicated three times. The data collected were subject to analysis of variances (ANOVA) and means were separated using Turkey Mean Simultaneous Test.
Authors' contributions
Akomolafe, Olatunji Modupe helped in the planning of the project and interpretation of the analyzed data, Salami, Olufemi Samson fine tuned the planed project, executed the project, collected data, analysed the data and drafted the manuscript. Olufemi-salami, Folasade Kemisola helped in data collection and editing the drafted manuscript.
Acknowledgments
My sincere gratitude goes to Mrs Alade Oluwatoyin, the chief Technologist of Biology department for making most of the material available for the research. I also appreciate Dr. Ogungbite Olaniyi for his encouragement during the drafting of this manuscript.
Abba-Kareem V.N., and Okagbue R.N., 1999, Studies on the microbiology of cassava flour. Nigerian Food Journal 9:85-91
Achinewhu, S.C., and Owuamanam, C.I., 2001, Garification of five improved cassava cultivars, physicochemical and sensory properties of gari yield, African Journal Root Tuber Crops, 4(2): 18 – 21
Ahaotu I., Ogueke C.C., Owuamanam C.I., Ahaotu, N.N., and Nwosu, J.N., 2013, Fermentation of undewatered cassava pulp by linamarase producing microorganisms: effect on nutritional composition and residual cyanide, American Journal of Food and Nutrition, 3(1):1-8
Amoa-Awua, W.K.A., Appoh, F., and Jaobsen, M., 1996, Lactic acid fermentation of cassava into 'Agbelima', International Journal of Food Microbiology, 31: 87-98
https://doi.org/10.1016/0168-1605(96)00967-1
Association of Official Analytical Chemists (AOAC), 1990, Official methods of analysis 15th edition, Washington, D.C., U.S.A, PP 140-145
https://law.resource.org/pub/us/cfr/ibr/002/aoac
Cardoso, A.P., Mirione, E., Ernesto, M., Massaza, F., Cliff, J., Haque, M.R., and Bradbury, J.H., 2005, Processing of cassava roots to remote cyanogens. Journal of food, Comp. Anal., 18, 451-460
https:/doi.org/10.1016/j.jfca.2004.04.002
Essers A.J.A., Bennik, M.H.J., and Nout, M.J.R., 1995, Mechanisms of increased linamarin degradation during solid substrate fermentation of cassava, World Journal Microbiology and Biotechnology, 11: 118-128
https:/doi.org/10.1007/BF00367096
PMid:24414645
Food and Agriculture Organization of the United Nations Statistics (FAOSTAT), 2011, database retrieved 2 February, 2013 (from: www.faostat.fao.org)
Gregory K.F., Reae, A.E., Khor, G.L., Alexander, J.C., Lumsden, J.H., and Losos, G., 1976, Conversion of carbohydrate to protein by high temperature fungi, Journal of Food Technology, 30(3): 30
International Institute of Tropical Agriculture (IITA), 1996, Annual Report, Plant Health Management Division, Ibadan, Nigeria
Kimaryo V.M., Massawe G.A., Olasupo N.A., and Holzaphel, W.H., 2000, The use of a starter culture in the fermentation of cassava for the production of Kivunde, a traditional tamanian food product, International Journal of Food Microbiology, 56: 179-190
https:/doi.org/10.1016/S0168-1605(00)00159-8
Kobawala S.C., Louenbe D., Keleke S., Houhowgan, J., and Gamba C., 2005, Reduction of the cyanide content during fermentation of cassava roots and leaves to produce Bikebi and Ntoba mbodi, two food products from Congo, African Journal Biotechnology, 4(7): 689-696
https:/doi.org/10.5897/AJB2005.000-3128
Kojima M., Iwatsuki N., Data E.S., Villages C.D.V., and Uritani I., 1983, Changes in cyanide content and linamarase activity in wounded cassava roots", Plant Physiology, 72: 186-189
https:/doi.org/10.1104/pp.72.1.186
PMid:16662957 PMCid: PMC1066192
Obilie E.M., Tano-Debrah K., and Amoa-Awua W.K., 2004, Souring and breakdown of cyanogenic glucoside during the processing of cassava into akyeke, International Journal of Food Microbiology, 93: 115-121
https:/doi.org/10.1016/j.ijfoodmicro.2003.11.006
PMid:15135588
Oboh G., 2005, Isolation and characterization of amylasefrom fermented cassava waste water, African Journal of Biotechnology, 4: 1117-1123
Okafor N., 1977, Microorganisms associated with cassava fermentation for garri production, Journal of Appied Bacteriology 41: 279-284
https:/doi.org/10.1111/j.1365-2672.1977.tb00693.x
Okigbo, R.N., 2009, Variation in phytochemical properties of selected fungicidal aqueous extract


. PDF(365KB)
. FPDF(win)
. HTML
. Online fPDF
Associated material
. Readers' comments
Other articles by authors
. Salami Olufemi Samson
. Akomolafe O.M.
. Olufemi-salami F.K.
Related articles
. Delayed transplanting
. Aged seedlings
. Yield reduction
. Potential yield
. Farmer’s field
Tools
. Email to a friend
. Post a comment