Research Article
Genome-wide Relationship Matrix–Based Heritability Estimation: Statistical Interpretation, Comparability, and Practical Diagnostics in the GCTA–GREML Framework 
 Author
  Correspondence author
Computational Molecular Biology, 2026, Vol. 16, No. 3
Received: 05 Apr., 2026 Accepted: 08 May, 2026 Published: 20 May, 2026
Heritability, as a core concept, plays a critical role in explaining trait variation and predicting selection response. Traditional heritability estimation relies on pedigree information but is limited by pedigree completeness and environmental confounding. With the development of high-throughput genotyping and genome-wide association studies, the restricted maximum likelihood method based on genomic relationship matrices (GCTA/GREML) has provided a new pathway for estimating the heritability of complex traits. This study reviews the theoretical framework and statistical assumptions of the GCTA and GREML families, elucidates their logic in variance decomposition and differences from pedigree-based models, and focuses on analyzing the sources and interpretive boundaries of the “missing heritability” problem. Further, the study explores methodological extensions such as the LOCO strategy, functional annotation partitioning, and bivariate analysis, and discusses their application value in complex trait dissection and crop breeding, supported by both simulation and empirical studies. The results indicate that GCTA/GREML not only promotes a paradigm shift in heritability research but also provides theoretical support for genomic selection and molecular breeding design. In the future, with the accumulation of sequencing data and multi-environment big data, this method is expected to more comprehensively uncover the genetic basis of complex traits.
Accordingly, this review focuses on clarifying the statistical interpretation of SNP-based heritability estimation rather than providing a general tutorial. Specifically, we (i) outline the statistical conditions required for meaningful comparisons between SNP-based and pedigree-based heritability estimates; (ii) formally define the estimand targeted by GREML and clarify its relationship to the concept of missing heritability; (iii) organize commonly used GREML extensions into a unified framework based on their inferential goals, assumptions, and diagnostic boundaries; and (iv) propose a workflow-oriented checklist to guide the interpretation of SNP heritability estimates in practice.
1 Introduction
Heritability, as a central concept in quantitative genetics, has played a fundamental role in explaining the sources of trait variation and guiding genetic improvement practices since Fisher established the framework of analysis of variance. It is defined as the proportion of phenotypic variance that can be attributed to genetic differences, and serves as a cornerstone concept in both quantitative genetics and breeding science (Yang et al., 2017; Srivastava et al., 2023). In breeding, heritability not only provides a quantitative scale for evaluating the potential for trait selection, but also constitutes a key parameter for predicting selection response and optimizing population improvement strategies (Zhu and Zhou, 2020). High heritability indicates that genetic variation accounts for a large proportion of phenotypic variance, thereby leading to higher efficiency of artificial selection; conversely, low heritability suggests a dominant role of environmental variation and consequently limited selection effectiveness. Therefore, whether in the design of crop and livestock breeding strategies or in the genetic epidemiology of complex human diseases, accurate estimation of heritability remains an unavoidable core issue at both theoretical and practical levels (Yang et al., 2017).
Traditional heritability estimation primarily relies on pedigree-based variance component models, which infer additive genetic variance by comparing phenotypic similarity between related and unrelated individuals (Yang et al., 2017; Srivastava et al., 2023). However, these methods depend heavily on the completeness of pedigree information and are often constrained by simplified assumptions regarding shared environmental effects. In populations lacking detailed pedigree records or affected by environmental confounding, both their applicability and accuracy are limited (Zhu and Zhou, 2020).
With the widespread adoption of high-throughput genotyping technologies and the emergence of genome-wide association studies (GWAS), the field has undergone a methodological revolution. Yang et al. (2010; 2011) proposed the genome-wide complex trait analysis (GCTA) framework based on single nucleotide polymorphisms (SNPs), and further developed the genomic-relatedness-based restricted maximum likelihood (GREML) method based on the genome-wide relationship matrix (GRM). By constructing a GRM and leveraging SNP-derived genetic similarity among individuals after removing close relatives, this approach decomposes phenotypic variance and overcomes the limitations of traditional pedigree-based methods (Yang et al., 2011; Zhu and Zhou, 2020). Compared with pedigree models, GCTA-GREML enables direct estimation of heritability from SNP data without requiring pedigree information, and supports partitioning of genetic variance by genomic regions or functional annotations, thereby substantially expanding the scope of heritability estimation (Zhu and Zhou, 2020; Srivastava et al., 2023).
However, the introduction of the GCTA and GREML framework has also triggered extensive debate regarding the issue of “missing heritability.” Classical twin and pedigree studies often yield relatively high heritability estimates, whereas SNP-based GREML estimates are typically substantially lower. This discrepancy has been interpreted as evidence that GWAS cannot fully explain the genetic variation underlying complex traits (Yang et al., 2011; 2015). Potential explanations include incomplete tagging of causal variants by SNPs, insufficient contribution from rare variants, complex genetic mechanisms such as non-additive effects and gene-environment interactions, as well as limitations of statistical modeling (Speed et al., 2016; Evans et al., 2017; Mathew et al., 2017). Furthermore, existing studies have shown that GCTA-GREML estimates are highly sensitive to factors such as GRM construction methods, sample composition, linkage disequilibrium (LD) patterns, and phenotypic measurement error, further highlighting the complexity of its application and the need for careful interpretation (Speed et al., 2012; Kumar et al., 2015; Evans et al., 2017).
Thus, the problem of missing heritability is not only a statistical challenge but also a genetic and biological one, and the associated debates have driven continuous innovation in both methodology and theory. In recent years, improvements such as LD-adjusted relationship matrices and multi-component modeling have been proposed, providing potential solutions to the limitations of the original GCTA-GREML framework (Mathew et al., 2017; Zhu and Zhou, 2020).
In crop breeding practice in China, DNA marker-assisted breeding was systematically summarized and promoted from the late 20th to early 21st century. Its core idea is to track quantitative trait loci (QTLs) or candidate genes using a limited number of molecular markers, thereby improving selection efficiency (Fang et al., 2001). This study systematically reviews the theoretical framework and statistical assumptions of GCTA and GREML relative to pedigree-based methods, clarifying their conceptual positioning and applicability boundaries in heritability estimation. The analytical framework adopted here is consistent with our previous systematic examination of the statistical continuity among linkage analysis, candidate gene strategies, and GWAS, emphasizing the continuity and division of roles among different methods in terms of statistical assumptions, signal scale, and inferential objectives (Fang and Wu, 2026). We focus on the derivation logic of the GREML method within variance component modeling, compare its estimands and interpretive scope with those of traditional pedigree models, and discuss the potential impact of model assumptions on result interpretation.
Based on the above background, this study does not aim to provide a general introductory overview, but rather focuses on the core issue of the “statistical interpretability boundaries of SNP-based heritability estimation,” with the goal of constructing an operational framework for analysis and interpretation. Specifically, the study addresses the following aspects: (1) systematically outlining the necessary conditions for comparability between SNP-based and pedigree-based heritability; (2) clarifying the statistical target of heritability estimated by GREML and the conceptual boundaries of “missing heritability”; (3) proposing a unified comparison template for common methodological extensions; and (4) providing a standardized workflow and diagnostic checklist for practical interpretation. Through theoretical derivation and empirical analysis, this study aims to offer a clearer understanding of the GCTA framework and its extensions, thereby providing a theoretical foundation and methodological reference for the application of heritability in complex trait research and crop breeding practice.
2 Basic Concepts and Classification of Heritability
Heritability is defined as a variance ratio under a specified statistical model, which depends on both the population and environmental conditions, and quantifies the proportion of phenotypic variation attributable to genetic variation. Therefore, heritability estimates are not directly comparable across different populations, environments, or modeling assumptions.
2.1 Narrow-sense and broad-sense heritability
Heritability is a core parameter in quantitative and statistical genetics, used to characterize the relative contribution of genetic factors to phenotypic variation under a given population, environment, and set of model assumptions (Vinkhuyzen et al., 2013; Yang et al., 2017). From a statistical perspective, heritability is fundamentally a variance ratio, rather than an intrinsic property of a trait or an individual.
Within the classical variance decomposition framework, heritability is typically divided into narrow-sense heritability (h²) and broad-sense heritability (H²).
Narrow-sense heritability is defined as the proportion of additive genetic variance (Vₐ) relative to total phenotypic variance (Vₚ):
![]()
where Vₚ represents the overall magnitude of phenotypic variation in the population. Because additive genetic effects are stably transmitted across generations and are cumulative, h² plays a central role in predicting the response to selection (e.g., under the Breeder’s equation framework), as well as in breeding value estimation and gene mapping studies (Evans et al., 2017; Yang et al., 2017). In practical breeding, narrow-sense heritability is generally regarded as the key indicator of expected selection gain, and its practical relevance often exceeds that of broad-sense heritability (Berry, 2024).
In contrast, broad-sense heritability captures the total contribution of all genetic effects to phenotypic variation, and is defined as:
![]()
where ![]() denotes dominance variance and
denotes dominance variance and ![]() denotes epistatic (gene-gene interaction) variance. Although H² theoretically reflects the total explanatory power of genetic factors, dominance and epistatic effects depend on allele frequencies and genotype combinations, resulting in limited reproducibility and operability across generations. Therefore, H² is generally not suitable for directly predicting selection response (Abney et al., 2001; Zhu et al., 2015).
denotes epistatic (gene-gene interaction) variance. Although H² theoretically reflects the total explanatory power of genetic factors, dominance and epistatic effects depend on allele frequencies and genotype combinations, resulting in limited reproducibility and operability across generations. Therefore, H² is generally not suitable for directly predicting selection response (Abney et al., 2001; Zhu et al., 2015).
In most outbred or natural populations, it typically holds that H² ≥ h², and the difference between the two reflects the presence and relative magnitude of non-additive genetic variance (Abney et al., 2001; Berry, 2024). Recent studies based on genome-wide marker data have shown that, for many complex traits, dominance variance contributes only modestly to total genetic variation, whereas rare and low-frequency variants may account for part of the “missing heritability” observed in earlier studies (Speed et al., 2012; 2016; Jang et al., 2022; Wainschtein et al., 2022; Srivastava et al., 2023). These findings help establish a consistent and interpretable framework for variance decomposition and prediction across evolutionary genetics and applied breeding (Bérénos et al., 2014; Zimmermann and Distl, 2023).
2.2 Pedigree-based vs. SNP-based heritability
Traditional heritability estimation relies primarily on pedigree information, constructing additive genetic covariance matrices among individuals based on kinship coefficients or identity-by-descent (IBD), and decomposing phenotypic variance within a linear mixed model framework (Vinkhuyzen et al., 2013; Bérénos et al., 2014). Such approaches have long played an important role in animal and plant breeding as well as in studies of natural populations. However, their estimation accuracy depends critically on the completeness and correctness of pedigree records. When shared environmental effects among related individuals are not adequately modeled, pedigree-based heritability estimates may be systematically upward biased.
With the development of high-throughput genotyping technologies and statistical genetic methods, genotype-based heritability estimation has emerged as an important complement to pedigree-based approaches. Methods represented by GCTA/GREML construct a genome-wide relationship matrix (GRM) from SNP data and estimate the additive genetic variance captured by markers within a restricted maximum likelihood (REML) framework (Speed et al., 2012; Evans et al., 2017; Yang et al., 2017).
It is important to emphasize that SNP-based heritability is not directly equivalent to the “true” heritability of a trait. Rather, it reflects the proportion of additive genetic variance that can be captured by a given set of markers under specific statistical model assumptions. Such estimates are typically obtained from samples with close relatives removed, in order to reduce confounding effects arising from shared environment and pedigree structure (Srivastava et al., 2023; Zimmermann and Distl, 2023). Therefore, differences between pedigree-based and SNP-based heritability do not necessarily imply “missing” genetic information, but more likely arise from differences in estimands, marker coverage, and modeling assumptions.
2.3 Sources of discrepancy and “missing heritability”
In numerous studies of complex traits, heritability estimates based on pedigree data are often higher than those derived from SNP-based approaches, giving rise to the so-called problem of “missing heritability” (Vinkhuyzen et al., 2013; Yang et al., 2017). From a statistical genetics perspective, this discrepancy should not be interpreted simply as a true loss of genetic information, but rather as a systematic difference arising from distinct estimands, data coverage, and modeling assumptions.
First, limited marker coverage is a major source of lower SNP-based heritability. Conventional genotyping arrays primarily capture common variants, while providing limited representation of rare variants, low-frequency variants, and structural variants. As a result, part of the genetic variance remains untagged, leading to downward-biased SNP heritability estimates (Wainschtein et al., 2019; Jang et al., 2022; Wainschtein et al., 2022). Recent analyses based on whole-genome sequencing data have demonstrated that rare variants can explain a portion of the previously “missing” heritability, further supporting this explanation.
Second, incomplete linkage disequilibrium (LD) constrains the ability of markers to capture the effects of causal variants. Even with high-density SNP data, LD between markers and true causal loci is often insufficient to fully reflect effect sizes, resulting in systematic underestimation of additive genetic variance (Speed et al., 2012; 2016; Evans et al., 2017). This issue is particularly pronounced in populations with complex LD structures or highly heterogeneous allele frequency distributions.
Third, confounding due to shared environmental effects may inflate pedigree-based heritability estimates. In pedigree studies, related individuals often share both genetic background and environmental conditions. If the model fails to adequately disentangle these contributions, environmental correlations may be incorrectly attributed to genetic variance, thereby inflating heritability estimates (Vinkhuyzen et al., 2013; Bérénos et al., 2014). In contrast, SNP-based methods are typically applied to samples with close relatives removed, reducing such confounding.
In addition, non-additive genetic effects and gene-environment interactions can further widen the gap between pedigree-based and SNP-based heritability estimates. Narrow-sense heritability and most SNP-based frameworks primarily focus on additive genetic variance, while dominance, epistasis, and their interactions with environmental factors are often not explicitly modeled (Abney et al., 2001; Chen et al., 2015; Zhu et al., 2015). These effects may be partially absorbed into genetic variance estimates in pedigree-based analyses, but are difficult to identify in SNP-based analyses using unrelated individuals.
In summary, “missing heritability” is more appropriately understood as a difference in the identifiability of genetic variance under different statistical frameworks, rather than as an actual absence of genetic mechanisms. Pedigree-based and SNP-based heritability estimates reflect different aspects of genetic architecture; their discrepancy provides important insights into the multi-layered genetic basis of complex traits, rather than constituting mutually contradictory evidence. To facilitate a systematic comparison between traditional marker-assisted approaches and genome-wide statistical genetic methods in terms of research objectives, statistical assumptions, and application scenarios, representative methods-including linkage analysis, candidate gene approaches, and GWAS/GCTA-GREML-are summarized in Table 1.
.png) Table 1 Comparison between traditional marker-assisted approaches and genome-wide statistical genetic methods Note: Traditional marker-assisted approaches rely mainly on linkage analysis and candidate gene strategies to identify QTLs or functional loci using a limited number of molecular markers in structured populations (Fang et al., 2001). Genome-wide methods, represented by GWAS and GCTA/GREML, use dense genome-wide markers to build statistical models for estimating heritability and dissecting the genetic architecture of complex traits. Although these approaches differ substantially in statistical assumptions and analytical scale, they are historically and conceptually connected in crop genetic improvement (Fang and Wu, 2026). |
3 Principles of Constructing the Genome-wide Relationship Matrix (GRM)
3.1 Standardized genotype matrix
The construction of the genome-wide relationship matrix (GRM) is fundamentally based on a standardized genotype matrix. For each SNP locus in diploid species, genotypes are typically encoded as 0, 1, or 2, representing the number of copies of the reference allele carried by an individual. However, directly using these raw genotype encodings may introduce bias, because differences in allele frequencies across loci can lead to heterogeneity in variance (Forni et al., 2011; Wang et al., 2025).
To avoid such bias, genotype data must be standardized. Let the population frequency of the reference allele at a given locus be p. The observed genotype ![]() for an individual at that locus is standardized as:
for an individual at that locus is standardized as:
![]()
This transformation centers the genotype (by subtracting its expectation, ![]() ) and scales it (by dividing by its standard deviation,
) and scales it (by dividing by its standard deviation, ![]() ), ensuring that all loci contribute comparably to the matrix calculation (Forni et al., 2011; Granato et al., 2018).
), ensuring that all loci contribute comparably to the matrix calculation (Forni et al., 2011; Granato et al., 2018).
This standardization has important statistical implications. On the one hand, it removes variance heterogeneity caused by allele frequency differences across loci, making the GRM estimation more reflective of true genetic similarity (Wang et al., 2025). On the other hand, it effectively distinguishes between allele frequency differences arising from random genetic drift and those reflecting genuine shared genetic background, thereby enabling the construction of a robust relationship matrix at the genome-wide level. This approach has been widely applied in genomic prediction, heritability estimation, and association studies, and has been integrated into various molecular breeding tools (Forni et al., 2011; Granato et al., 2018).
3.2 GRM formula and intuitive interpretation
After constructing the standardized genotype matrix ![]() , the GRM can be expressed as:
, the GRM can be expressed as:
![]()
where M denotes the total number of SNPs across the genome, and each matrix element ![]() represents the genomic similarity between individuals i and j (Forni et al., 2011; Wang et al., 2025).
represents the genomic similarity between individuals i and j (Forni et al., 2011; Wang et al., 2025).
Intuitively, the GRM measures the similarity between two individuals based on their standardized genotypes across all marker loci, and its values reflect their additive genetic relatedness at the population level. The diagonal elements represent self-relatedness (or inbreeding), with an expected value close to 1, while off-diagonal elements quantify pairwise relatedness between individuals. Values approaching 1 indicate high genetic similarity, whereas values close to 0 suggest near independence.
From a statistical perspective, the GRM can be interpreted as a genome-wide weighted average of identity-by-state (IBS) (Forni et al., 2011). Unlike traditional pedigree-based relationship matrices, the GRM does not rely on prior pedigree information but is constructed directly from molecular data, enabling it to capture realized genetic similarity. This property allows the GRM to be applied not only to large-scale natural populations without pedigree records, but also to more accurately characterize complex population structures and latent genetic diversity (Bilton et al., 2024; Wang et al., 2025).
3.3 Example: visualization and comparison of GRM structures in human and crop populations
In high-level human genetics studies, the GRM is often visualized using heatmaps or distributions of pairwise relatedness to intuitively illustrate additive genetic similarity among individuals (Figure 1). For example, in studies based on the UK Biobank (Yang et al., 2015; Speed et al., 2016; Hou et al., 2019), GRM heatmaps typically exhibit a highly sparse structure centered along the diagonal: diagonal elements are close to 1, reflecting the standardized genetic variance of individuals themselves, while off-diagonal elements are mostly concentrated near zero, with weak clustering patterns appearing only in the presence of subtle population structure or residual relatedness. This structural feature indicates that, after stringent quality control (QC) and removal of close relatives, the GRM can stably capture SNP-derived additive genetic similarity among unrelated individuals.
.png) Figure 1 Illustrative comparison of GRM structures in human and crop populations Caption: Illustrative schematic based on published studies (Yang et al., 2015; Speed et al., 2016). Panel A shows a schematic GRM heatmap representative of large human cohorts after standard quality control and removal of close relatives, as commonly observed in studies such as UK Biobank-based analyses. The matrix is characterized by strong diagonal elements (self-relatedness) and sparse off-diagonal values centered near zero, reflecting weak pairwise genetic relatedness among largely unrelated individuals. Panel B illustrates a typical GRM structure for crop populations, where pronounced block-like patterns arise due to strong population structure, limited numbers of chromosomes, extended linkage disequilibrium, and shared breeding history. These contrasting patterns highlight that, although the statistical definition of the GRM is consistent across species, its empirical structure is highly dependent on population history, LD architecture, and sampling design. The figure is schematic and intended for diagnostic illustration rather than representation of a specific dataset. Note that GRM values are not constrained to the interval [−1, 1]; diagonal elements and highly related pairs may slightly exceed 1 due to finite marker density and allele-frequency estimation. |
Similar structural patterns can also be observed in crop populations, but their manifestation is strongly influenced by population composition and linkage disequilibrium (LD) structure. In inbred populations such as rice or maize, where the number of chromosomes is limited, LD blocks are relatively large, and subpopulation differentiation is pronounced, GRM heatmaps often display clearer block-like structures corresponding to different genetic backgrounds or breeding origins (Granato et al., 2018). This comparison highlights that, although the statistical definition of the GRM remains consistent across species, its empirical structure is highly dependent on population history, LD architecture, and sampling design.
It is important to note that the elements of the GRM represent standardized additive genetic covariances, rather than correlation coefficients. Therefore, when the number of markers is limited and allele frequencies are estimated from the sample, diagonal elements or values for highly related individuals may slightly exceed 1.
In this context, GRM heatmaps serve not only as a visualization tool, but also as an important diagnostic instrument for understanding population structure, assessing potential confounding factors, and interpreting subsequent GREML-based heritability estimates.
4 GREML and REML Estimation
4.1 Model derivation
Heritability estimation based on the genome-wide relationship matrix (GRM) is typically conducted within the framework of a linear mixed model (LMM) (Da et al., 2014; Yang et al., 2016; Zhou et al., 2020). Its general form can be written as:
![]()
where ![]() denotes the vector of phenotypic observations,
denotes the vector of phenotypic observations, ![]() represents fixed effects (e.g., population structure, environmental factors, or other covariates),
represents fixed effects (e.g., population structure, environmental factors, or other covariates), ![]() denotes the random additive genetic effects, and
denotes the random additive genetic effects, and ![]() is the independent residual error term. Unlike traditional heritability estimation approaches, the LMM framework allows for simultaneous control of systematic confounding and estimation of genotype-related variance components within a unified model.
is the independent residual error term. Unlike traditional heritability estimation approaches, the LMM framework allows for simultaneous control of systematic confounding and estimation of genotype-related variance components within a unified model.
In variance decomposition, the random genetic effects are assumed to follow a multivariate normal distribution with mean zero and a covariance structure proportional to the GRM:
![]()
where ![]() denotes the additive genetic variance and
denotes the additive genetic variance and ![]() is the GRM. The environmental residuals are assumed to follow:
is the GRM. The environmental residuals are assumed to follow:
![]()
Accordingly, the variance-covariance matrix of the phenotype can be expressed as:
![]()
Under this model, heritability is estimated as:
![]()
This framework provides the theoretical foundation for GREML (genomic-relatedness-based restricted maximum likelihood), enabling the estimation of additive genetic variance explained by genome-wide markers through statistical inference (Da et al., 2014; Yang et al., 2016; Zhou et al., 2020). Furthermore, to better capture complex genetic architectures, extensions of the LMM have been proposed, such as models incorporating multiple random effects or covariance structures among random effects (Zhou et al., 2019; 2020).
4.2 REML estimation and the maximum likelihood framework
In terms of parameter estimation, GREML typically relies on restricted maximum likelihood (REML). Unlike conventional maximum likelihood (ML), REML eliminates fixed effects by integrating them out of the likelihood function, thereby optimizing variance parameters based on residuals. This approach effectively avoids bias in variance component estimation caused by fixed-effect estimation, and is particularly advantageous in complex models and finite-sample settings (Dao et al., 2021; Meyer, 2023).
In practical implementation, REML is carried out via numerical optimization of the log-likelihood function. The GCTA software employs the AI-REML (Average Information REML) algorithm, which iteratively updates parameters using the average information matrix and achieves efficient estimation of variance components (Yang et al., 2016; Strandén et al., 2024). BOLT-REML introduces stochastic projection and approximation techniques to substantially reduce computational complexity in large-scale datasets, making it suitable for cohorts with sample sizes on the order of hundreds of thousands to millions (Border and Becker, 2019). The GEMMA software also implements the REML framework and extends it to multivariate and Bayesian analyses, demonstrating robust convergence properties in small to medium-sized datasets (Meyer, 2023).
Recent methodological advances, including principal component-based reparameterization and stochastic optimization algorithms, have further improved the scalability and adaptability of REML estimation for large and complex datasets (Strandén et al., 2024).
4.3 Validation using simulated and empirical data
The validity of the GREML method is typically assessed through a combination of simulation studies and empirical data analyses. Simulation studies have shown that, under correct model specification and sufficiently large sample sizes, GREML can provide unbiased estimates of heritability (Da et al., 2014; Cesarani et al., 2018; Zhou et al., 2020). However, in small sample settings (e.g., hundreds of individuals), the limited information content of the GRM leads to large estimation variance, and the estimates become sensitive to assumptions regarding population structure and phenotypic distribution, potentially introducing bias (Cesarani et al., 2018; Meyer, 2023).
In contrast, in large cohorts (tens of thousands to millions of individuals), GREML is capable of more accurately capturing the genetic variation explained by genome-wide markers. Approximate methods such as BOLT-REML have been shown, in human population studies (e.g., UK Biobank), to produce heritability estimates close to true values while effectively controlling for population structure and batch effects (Nolte et al., 2017; Ni et al., 2018). In crop populations, such as maize and wheat with genome-wide data, GREML applications have revealed the heritable architecture of complex quantitative traits and provided theoretical guidance for subsequent GWAS and genomic selection. Further methodological extensions, such as CORE GREML, allow for covariance among random effects and have demonstrated improved performance over standard GREML in the presence of complex genetic architectures (Zhou et al., 2019; 2020).
5 Methodological Extensions and Variants
To facilitate comparison of different extensions in terms of statistical objectives and applicability, this study adopts a unified analytical framework for commonly used GREML-based methods (Table S2).
5.1 LOCO (leave-one-chromosome-out) strategy
When estimating heritability and performing genomic prediction within the GREML framework, sources of bias embedded in model specification are not always immediately apparent. Among these, proximal contamination represents a typical issue with important methodological implications. Specifically, when analysis focuses on a particular chromosome or a localized genomic region, if markers from that same region are simultaneously used to construct the genomic relationship matrix (GRM), the linkage disequilibrium (LD) information they carry can “feed back” into the model through the relationship structure. This feedback mechanism leads to a systematic inflation of the estimated contribution of the focal region, fundamentally reflecting a lack of identifiability in parameter decomposition and the resulting estimation bias (Yang et al., 2011; Van den Berg et al., 2019).
The LOCO (leave-one-chromosome-out) approach offers a targeted correction strategy for this problem. Rather than restructuring the model in a complex way, its core logic is to deliberately exclude all markers from the chromosome of interest when constructing the GRM used to estimate that chromosome’s genetic effect. In doing so, it effectively blocks the indirect feedback pathway through which local LD information influences its own effect estimate (Yang et al., 2011). This strategy implicitly relies on the assumption that genetic contributions from different chromosomes can be treated as approximately independent in a statistical sense, such that removing information from the target chromosome does not substantially impair the modeling of the remaining genomic background. Under this condition, LOCO can mitigate endogenous bias in local effect estimation without altering the overall modeling framework.
From the perspective of genomic architecture, the advantages of LOCO become particularly evident under certain conditions. In organisms with a relatively small number of chromosomes, extended LD blocks, or phenotypic variation driven by a limited number of large-effect loci, local LD structures are more likely to generate strong signal coupling within the GRM, thereby amplifying the impact of proximal contamination. This feature is especially pronounced in many crop genomes, making the LOCO strategy highly compatible with studies in agricultural genetics and breeding. In contrast, for species with a larger number of chromosomes and rapid LD decay, the severity of proximal contamination is often reduced, and the marginal benefit of applying LOCO correspondingly diminishes.
It is important to note that LOCO is not a universal solution for bias correction. Its utility is primarily confined to addressing proximal contamination and does not extend to systematic control of population structure, long-range LD heterogeneity, or other complex confounding factors. Therefore, its application should be guided by empirical evaluation rather than assumed necessity. In practice, researchers may compare heritability estimates or marker effect sizes obtained from standard GRM-based models and LOCO-adjusted models to assess the extent of proximal contamination (Van den Berg et al., 2019). If results are highly consistent across the two settings, the additional computational burden and model partitioning introduced by LOCO may not yield substantial benefits. Conversely, pronounced discrepancies indicate that local LD “feedback” is indeed influencing parameter estimation, in which case the use of a leave-one-chromosome-out strategy is both statistically justified and practically valuable.
5.2 Partitioning heritability by functional categories
In the traditional GREML framework, all SNPs are assumed to have equal prior weights by default; that is, their contributions to the overall genetic variance are treated as statistically homogeneous. However, this assumption is often difficult to sustain for complex traits, because different functional regions of the genome vary substantially in their biological mechanisms and evolutionary constraints, which in turn leads to spatial heterogeneity in the distribution of genetic effects. Against this background, research approaches that partition heritability by functional category have gradually developed. Their core objective is to reveal how genetic variance is distributed across different functional regions, thereby extending the question from quantifying “the magnitude of heritability” to interpreting “the structural sources of heritability.” This approach can not only reduce heterogeneity-related bias in overall estimates, but also substantially improve the biological interpretability of the results, allowing heritability estimates to be more closely aligned with functional genomic information (Finucane et al., 2015; Gazal et al., 2018).
In terms of methodological implementation, such models usually rely on existing functional annotation systems, in which genome-wide SNPs are classified into categories such as coding regions, regulatory regions, and conserved sequences. A genetic relationship matrix (GRM) is then constructed separately for each category. Subsequently, within an extended multi-GRM GREML framework, multiple variance components are introduced simultaneously to jointly estimate the genetic contributions of different functional regions (Finucane et al., 2015; Wei et al., 2019). A key assumption underlying this modeling strategy is that SNPs in different functional categories differ systematically in the distribution of their effect sizes and in their relationships with linkage disequilibrium (LD) structure, and that these differences can be statistically identified and quantified through partitioned modeling.
From the perspective of data suitability, this type of method places relatively high demands on sample size and annotation quality. A larger sample size helps stabilize the estimation of multiple variance components, while high-quality functional annotation is a prerequisite for ensuring that the partitioning results have biological meaning. The number of SNPs must also be sufficient to support multi-category partitioning; otherwise, model parameters may face identification difficulties. In human and crop genetic studies, this method is particularly appropriate when the research focus shifts from a single estimate of heritability to the analysis of genetic architecture, namely when attention is directed toward the relative importance of different functional regions in contributing to a trait.
It should be noted that functional partitioning of heritability is sensitive in practice to correlations among annotations. Because different functional categories often overlap in genomic space and may exhibit highly correlated LD structures, such multicollinearity can directly affect the identifiability of variance components, leading to unstable estimates or ambiguity in interpretation. Therefore, when interpreting the results, sensitivity analyses should be incorporated to evaluate model robustness, and conclusions regarding “enrichment” in any single region should be treated with caution. Statistical association should not be equated simplistically with clear biological causality (Gazal et al., 2018).
5.3 Bivariate and cross-trait genetic correlation
Under the single-trait GREML framework, researchers can estimate the genetic variance of a single phenotype with relative robustness. However, such models essentially remain confined to variance partitioning “within a trait” and are therefore limited in addressing the more biologically meaningful question of whether different traits share a common genetic basis. Against this background, bivariate and cross-trait GREML models have gradually become important extensions in the genetic analysis of complex traits. By jointly modeling multiple phenotypes, this approach not only improves the characterization of genetic covariance structures, but also enables the quantification of correlations between traits driven by shared genetic factors (Zhou et al., 2020).
Bivariate GREML is, in essence, an extension of the variance-covariance structure of the classical linear mixed model. Within the same statistical framework, the model simultaneously estimates the genetic variance and environmental variance of two traits, as well as the genetic covariance between them, from which the genetic correlation coefficient can be derived. Its validity depends on several key assumptions. First, the genetic effects of different traits should be representable by a common genomic relationship matrix (GRM). Second, the sample data should contain sufficient information to support effective identification of the covariance structure (Figure 2).
.png) Figure 2 Schematic illustration of genetic covariance and genetic correlation in a bivariate GREML model
Note: Each trait is decomposed into a genetic component and a residual component. The bivariate GREML framework jointly estimates the additive genetic variances of Trait 1 and Trait 2, as well as their genetic covariance, using a common genome-wide relationship matrix (GRM). The genetic correlation |
Ideally, the two traits should be measured in the same group of individuals or in highly overlapping samples, so that genetic and environmental effects can be partitioned within a unified reference framework. Adequate sample size is also particularly important for improving the precision of covariance estimation. In crop genetic improvement research, this method has been widely used to elucidate the intrinsic relationships among yield, stress resistance, and quality traits, and it shows particular advantages in identifying potential trade-offs between traits (Derbyshire et al., 2024).
In practical applications, bivariate GREML models are highly sensitive to data quality and model specification. On the one hand, phenotypic measurement error can directly interfere with the estimation of variance and covariance components, thereby increasing the uncertainty of genetic correlation estimates. On the other hand, insufficient sample overlap or limited information on the covariance structure may also lead to unstable parameter estimation. Therefore, when interpreting results, particular attention should be paid to the standard errors and confidence intervals of genetic correlation coefficients, so as to avoid overinterpreting genetic correlations in situations where sample size is limited or trait correlations are mainly driven by environmental factors.
6 Interpretation of Results and Common Pitfalls
6.1 Proper interpretation of “missing heritability”
This section clarifies the concept of “missing heritability” by focusing on the statistical comparability between SNP-based and pedigree-based heritability estimates. In studies based on GREML (genomic-relatedness-based restricted maximum likelihood) or SNP-derived heritability, a commonly observed phenomenon is that the proportion of phenotypic variance explained by genotyped SNPs is often substantially lower than heritability estimates derived from pedigree or twin studies (Speed et al., 2016; Evans et al., 2017; Yang et al., 2017; Wainschtein et al., 2022). This discrepancy should not be interpreted as evidence that the trait itself is weakly heritable, but rather as a reflection of differences in the identifiability of genetic variance under distinct statistical frameworks.
From a statistical genetics perspective, the systematic downward bias of SNP-based heritability primarily arises from the capturability constraints imposed by genotyping platforms, including marker coverage boundaries, heterogeneity in linkage disequilibrium (LD) structure, and the allele frequency (AF) spectrum of variants included in the analysis (Speed et al., 2016; Yang et al., 2017; Génin, 2019). Common SNP arrays provide strong tagging of common variants but have limited coverage of low-frequency, rare, and structural variants, which may contribute non-negligibly to total genetic variance (Speed et al., 2016; Wainschtein et al., 2022).
Moreover, when LD between causal variants and genotyped markers is weak, the effects of causal loci cannot be fully captured by tagging SNPs, leading to systematic underestimation of SNP-based heritability (Speed et al., 2012; 2016; Evans et al., 2017). The relationship between effect size distribution and the AF spectrum is also critical: when genetic contributions are driven primarily by rare variants or variants located in low-LD regions, the discrepancy between SNP-based and pedigree-based heritability is further amplified (Speed et al., 2016; Evans et al., 2017; Wainschtein et al., 2022).
6.1.1 Necessary conditions for comparing “heritability differences”: from phenomenon to statistical framework
When discussing the discrepancy between pedigree-based heritability and SNP-based heritability, a frequently overlooked yet fundamental issue is whether such a comparison is statistically valid in the first place. These two types of estimates arise from distinct data structures and modeling frameworks; their differences are therefore not merely numerical deviations, but are embedded within their respective variance decomposition systems. Without strict alignment of underlying assumptions and conditions, the so-called “difference” often reflects only a superficial contrast between heterogeneous statistical objects, rather than an interpretable biological signal.
Consistency in phenotype definition constitutes the foundation of any meaningful comparison. A phenotype is not simply an observed variable; it directly embodies the variance structure subject to decomposition. Differences in measurement protocols, normalization procedures, or aggregation strategies across time points or traits can all alter the composition of phenotypic variance, thereby affecting both the numerator and denominator of heritability estimates. Once the phenotype definition shifts, even identical underlying genetic effects may yield systematically different estimates. As a result, comparisons lacking a unified phenotypic framework are unlikely to possess statistical interpretability.
The distribution of environmental factors and the structure of measurement error further define the reference frame for heritability estimation. Heritability is, by definition, the proportion of genetic variance relative to total phenotypic variance, and the environmental contribution to this total is highly dependent on the population context and study design. If studies differ substantially in environmental exposure, population composition, or sources of error, the decomposed variance components no longer belong to a common statistical population. Under such conditions, comparisons of heritability lose their foundation in a shared probability space.
In pedigree-based models, the treatment of shared environmental effects plays a critical role in identifying genetic variance. In twin or family studies, phenotypic similarity among related individuals arises from both genetic and shared environmental sources. If the model fails to adequately disentangle these components, part of the environmental effect may be misattributed to genetic variance, leading to systematic overestimation of pedigree heritability. This bias is structural rather than random, and often manifests as an apparent inflation of pedigree-based estimates relative to SNP-based heritability.
Finally, the coverage of the SNP marker system imposes a fundamental constraint on SNP-based heritability estimates. Estimates derived from genotyping arrays or sequencing data can only capture the genetic variation represented by observed markers and their linkage disequilibrium with causal variants. If low-frequency variants, rare variants, or structural variants are insufficiently represented, the corresponding genetic variance will be systematically missed. Therefore, even under correct model specification, SNP-based heritability cannot, in principle, reach the total level reflected by pedigree-based estimates.
6.1.2 Conceptual boundaries and interpretation of snp-based heritability
Within this analytical framework, the concept of SNP-based heritability requires a more precise definition. Rather than viewing it as a “lower-bound estimate” or a proxy for total trait heritability, it is more appropriately understood as the proportion of genetic variance captured by the observed SNP set under specific marker coverage and modeling assumptions-commonly referred to as “chip-capturable heritability.” This definition highlights its conditional and tool-dependent nature, rather than treating it as a comprehensive representation of the genetic architecture of a trait.
Accordingly, interpreting SNP-based heritability derived from methods such as GREML as direct evidence of “low trait heritability” is not statistically justified. Such interpretations overlook the dependence of the estimate on marker coverage, linkage disequilibrium structure, and parametric modeling assumptions.
A more appropriate perspective is that SNP-based heritability reflects the joint explanatory capacity of multiple factors within a given analytical framework. First, the extent to which genomic markers cover true genetic variation determines the upper bound of observable genetic signal. Second, the structure of linkage disequilibrium governs whether causal variants can be effectively proxied by measured markers. Third, assumptions regarding allele frequency distributions and effect sizes further influence both the bias and variance of the estimate (Speed et al., 2016; Yang et al., 2017; Génin, 2019; Wainschtein et al., 2022).
6.2 Interpretation checklist: a standardized workflow for GREML-based SNP heritability
After obtaining an SNP-based heritability estimate within the GREML framework, a single numerical value alone does not provide sufficient explanatory power. Its statistical significance and biological interpretation both depend on the data-generating process, model specification, and stability of the estimation procedure. Therefore, a sound interpretation should not be limited to reporting the estimate itself, but should be grounded in a systematic evaluation of the entire analytical process. In other words, interpreting SNP heritability is a form of “conditional inference,” whose validity depends on the consistency among data quality, model assumptions, and methodological suitability.
The foundation of result interpretation lies in the reliability of the data and the appropriateness of phenotypic modeling. The extent to which SNP markers cover genome-wide variation directly constrains the range of genetic variance that can be identified. In particular, when only common-variant genotyping array data are used, low-frequency variants, rare variants, and structural variants are not sufficiently captured. Their corresponding genetic contributions are therefore inevitably missed, leading to a systematic underestimation of SNP heritability, a phenomenon that has been clearly supported by large-scale sequencing studies (Wainschtein et al., 2019; 2022). Statistical processing of phenotypes is equally important. Phenotypes that have not been appropriately transformed or adjusted for systematic environmental factors often make effective variance decomposition difficult. In multi-environment or repeated-measure settings, if environmental heterogeneity is not explicitly modeled, part of the environmental effect may be incorrectly absorbed into the residual term, thereby weakening the ability to identify genetic variance (Evans et al., 2017; Yang et al., 2017).
The treatment of population structure and relatedness constitutes another important source of estimation bias. Systematic differences introduced by population stratification, together with correlation structures arising from cryptic relatedness, may distort heritability estimates if not adequately controlled, and the direction of such bias is not necessarily fixed. In individual-level analyses, correcting for principal components or constructing an appropriate mixed-model structure to absorb population-structure effects is a basic requirement for maintaining valid estimation. Meanwhile, the identification of close relatives and the thresholds used for their exclusion should also be subjected to sensitivity analysis, so as to avoid unstable inference caused by differences in sample structure. When individual-level data are unavailable, summary-statistics-based approaches, such as LDSC or SumHer, can serve as alternative strategies for robustly modeling population stratification and provide important references for interpreting GREML results (Ge et al., 2016; Speed et al., 2016; Speed and Balding, 2018; Speed et al., 2022).
The dependence of heritability estimation on the construction of the genomic relationship matrix (GRM) means that its interpretation must be situated within specific modeling assumptions. Because linkage disequilibrium (LD) patterns among SNPs are complex, failure to appropriately account for LD heterogeneity, or weak LD between genotyped markers and causal variants, may lead to systematic biases in different directions (Speed et al., 2012; 2016). In practice, a single standard GRM is often insufficient to fully characterize genetic architecture. Introducing LD correction or using stratified GRM models to partition SNPs by allele-frequency intervals or functional annotation categories can, to some extent, reduce model-specification bias and improve the resolution with which sources of genetic variance are interpreted. In addition, cross-checking results with frameworks that are more sensitive to LD structure, such as SumHer, helps assess the degree to which the estimates depend on assumptions embedded in GRM construction (Speed and Balding, 2018; Speed et al., 2022).
However, even when model specification is appropriate, the statistical stability of the estimates still needs to be evaluated separately. The convergence of the REML algorithm, the magnitude of standard errors, and the width of confidence intervals are all key indicators for judging result reliability. In particular, when boundary solutions occur, such as genetic variance estimates approaching zero or reaching the upper bound of the parameter space, statistical explanations such as insufficient sample size or limited model information should be considered first, rather than assigning direct biological meaning to such results. For complex traits or studies with limited sample sizes, resampling methods such as jackknife or bootstrap can be used to evaluate estimation variability, and increasing sample size through multi-cohort joint analysis has also been shown to be an effective way to improve estimation precision (Evans et al., 2017; Wainschtein et al., 2022).
Given these multidimensional constraints, interpretation based on a single method is clearly limited. Cross-validating GREML estimates with other methods is therefore a key strategy for improving the robustness of conclusions in current research. Because different methods differ in how they capture genetic variance, their estimates for the same trait often show systematic deviations. Comparing individual-level GREML results with summary-statistics-based LDSC or SumHer estimates can help identify biases introduced by differences in data structure or model assumptions (Speed et al., 2016; Speed and Balding, 2018). Especially when SNP heritability is substantially lower than family-based heritability, the result should be interpreted comprehensively in terms of marker coverage, LD structure, non-additive genetic effects, and gene-environment interactions, rather than being simply attributed to methodological limitations or missing genetic information (Yang et al., 2017; Wainschtein et al., 2022).
In essence, SNP heritability estimated under the GREML framework is a quantitative expression of the “genetic variance identifiable under given data and model conditions.” The interpretation of SNP heritability results should follow the standardized checklist shown in Supplementary Table S1. Only when data quality, model specification, statistical stability, and methodological consistency have all been adequately verified can the estimate serve as an important basis for understanding the genetic architecture of complex traits. Integrating statistical inference with the biological background of the trait and developing an interpretive pathway based on multiple lines of evidence has become a mainstream paradigm in contemporary statistical genetics.
7 Discussion
7.1 Implications of SNP-based heritability estimation for the “missing heritability” debate
The issue of “missing heritability” has long been a central debate in quantitative genetics and population genomics. Pedigree-based studies often report relatively high heritability estimates, whereas SNP-based approaches-such as GREML, which estimates genetic variance via the genome-wide relationship matrix-typically yield lower values (Evans et al., 2017; Yang et al., 2017). This discrepancy arises from multiple factors, including the limited capture of low-frequency and rare variants, incomplete linkage disequilibrium (LD) between genotyped markers and causal mutations, the omission of epistatic interactions, and the cumulative effects of numerous small-effect alleles underlying highly polygenic traits (Hou et al., 2019; Holland et al., 2020). In recent years, with the increasing use of whole-genome sequencing and the development of more refined LD-aware modeling approaches, this gap has narrowed to some extent. However, for highly polygenic traits, a portion of heritability remains unexplained (Evans et al., 2017; Hou et al., 2019).
Importantly, SNP-based heritability should not be interpreted simply as an underestimate of the true heritability, but rather as a quantitative characterization of the variance explained by the observed set of markers (Yang et al., 2017). This perspective has prompted a conceptual shift in how heritability is defined: the issue is not whether heritability is truly “missing,” but whether the association between genotyped markers and causal variants is incomplete. Consequently, SNP-based heritability serves as an important indicator of the capture efficiency of genotyping platforms and provides a theoretical basis for designing higher-density genotyping strategies and improving the dissection of complex traits.
7.2 Practical implications for plant breeding
For plant breeding, SNP-based heritability estimation has substantial practical relevance. First, it provides a quantitative basis for assessing the predictability of complex quantitative traits. A high SNP-based heritability estimate suggests that the major genetic components of a trait are effectively captured by existing genotyping markers, indicating that genomic selection (GS) models are likely to achieve high predictive accuracy for that trait (Schmidt et al., 2019; Zhu and Zhou, 2020). Conversely, a low estimate implies that a significant portion of genetic variation remains unexplained, highlighting the need for increased marker density, incorporation of rare variants, or improved modeling of gene-environment interactions (Zhu and Zhou, 2020).
Second, SNP-based heritability provides valuable guidance for population design and resource allocation. In major crops such as rice, maize, and wheat, factors such as population size, genetic background, and sample representativeness significantly influence the stability of heritability estimates. By applying GREML in early-stage populations, breeders can rapidly assess whether it is necessary to increase sample size, optimize crossing schemes, or adjust selection strategies for specific traits (Schmidt et al., 2019; Holland et al., 2020). Furthermore, partitioning heritability by functional annotation or allele frequency enables breeders to identify genomic regions or variant classes that should be prioritized for improvement, thereby enhancing selection efficiency (Weissbrod et al., 2019; Zhu and Zhou, 2020).
7.3 Integration with PRS, fine-mapping, and downstream methods
Unlike early marker-assisted breeding approaches centered on QTL mapping and candidate genes (Fang et al., 2001), the GCTA/GREML framework focuses on the genome-wide proportion of genetic variance captured by markers. Its results are therefore more suitable for evaluating the predictive limits of traits, rather than directly identifying functional loci. The value of GREML lies not only in heritability estimation itself, but also in its integrative role within the broader analytical pipeline.
First, GREML is closely related to polygenic risk scores (PRS). SNP-based heritability provides a theoretical upper bound for PRS prediction accuracy. Specifically, if a trait has low SNP-based heritability, improvements in model complexity alone cannot overcome this fundamental limitation (Yang et al., 2017; Zhang et al., 2018; Wang et al., 2023). Recent studies have demonstrated that incorporating functional annotations and LD structure, as well as accounting for uncertainty in individual-level risk estimation, can substantially improve PRS performance (Weissbrod et al., 2019; Ding et al., 2021).
Second, the variance decomposition framework of GREML is highly compatible with fine-mapping approaches. By partitioning heritability across chromosomes, functional annotations, or specific gene sets, GREML can provide prioritization for identifying causal variants, thereby improving both the resolution and biological interpretability of fine-mapping results (Weissbrod et al., 2019; Gazal et al., 2022).
Taken together, GREML is not merely a tool for heritability estimation, but a methodological bridge linking variant discovery, statistical inference, and functional interpretation, thereby offering a systematic framework for future precision breeding and molecular improvement.
8 Conclusion
The development of GCTA and GREML has established a standardized framework for estimating the heritability of complex traits using genome-wide SNP data. Unlike traditional pedigree-based approaches, these methods construct a genomic relationship matrix (GRM) and decompose phenotypic variance within a linear mixed model framework, enabling robust heritability estimation in natural or breeding populations even in the absence of complete pedigree information. This framework represents a fundamental transition from classical quantitative genetics to genotype-driven modern molecular genetics, and demonstrates strong scalability and practical utility as population sizes continue to increase. Furthermore, GCTA/GREML allows heritability to be partitioned by chromosomal segments, functional annotations, or genomic regions, thereby providing a more biologically informative perspective on the genetic architecture of complex traits.
However, it is essential to recognize that GCTA/GREML estimates rely on a set of statistical assumptions and boundary conditions. First, these methods typically assume that SNP effects follow a multivariate normal distribution and primarily focus on additive genetic variance, with limited consideration of dominance and epistatic effects. Second, the heritability estimates obtained from GCTA/GREML reflect only the variance captured by genotyped or imputed markers, and are therefore influenced by marker density, allele frequency distribution, and the extent of linkage disequilibrium (LD) with causal variants. Consequently, such estimates should not be interpreted as the “true heritability” of a trait, but rather as conditional estimates based on observable genomic variation. Ignoring these underlying assumptions may lead to overinterpretation-for example, incorrectly attributing “missing heritability” to methodological limitations rather than to inherent constraints in data coverage and population characteristics.
In crop genetic improvement and molecular breeding, GCTA and GREML also demonstrate substantial practical value. On the one hand, they enable the characterization of the molecular genetic architecture of complex traits, providing a theoretical basis for quantitative trait locus (QTL) discovery and genomic selection model development. On the other hand, by comparing heritability estimates across traits or environmental conditions, it is possible to identify traits that are highly sensitive to environmental variation, thereby informing precision breeding strategies. In major crops such as rice, maize, and wheat, numerous empirical studies have demonstrated that GREML can effectively distinguish between the selectable and non-selectable components of trait variation, offering critical guidance for breeding target definition and resource allocation.
Overall, the GCTA and GREML family of methods have not only transformed the paradigm of heritability research in quantitative genetics, but have also provided practical tools for dissecting complex traits and advancing molecular breeding. Looking forward, with the continued development of population-scale sequencing, rare variant detection, and large-scale multi-environment datasets, GREML-based heritability estimation is expected to become increasingly refined and comprehensive. This progress will further enhance its role in elucidating the genetic basis of complex traits and in guiding genome-based breeding strategies.
Author Contributions
Xuanjun Fang conducted this study, including literature review, data analysis, and the drafting and revision of the manuscript. The author has read and approved the final version of the manuscript.
Acknowledgements
This work was supported by a Major Program of the National Natural Science Foundation of China (Grant No. 30490254).
Abney M., McPeek M., and Ober C., 2001, Broad and narrow heritabilities of quantitative traits in a founder population, American Journal of Human Genetics, 68(5): 1302-1307.
https://doi.org/10.1086/320112
Bérénos C., Ellis P., Pilkington J., and Pemberton J., 2014, Estimating quantitative genetic parameters in wild populations, Molecular Ecology, 23: 3434-3451.
https://doi.org/10.1111/mec.12827
Berry D., 2024, Many farmers want a prediction of future performance, Journal of Animal Science, 102: 51.
https://doi.org/10.1093/jas/skae234.056
Bilton T., Sharma S., Schofield M., Black M., Jacobs J., Bryan G., and Dodds K., 2024, Construction of relatedness matrices in autopolyploid populations using low-depth high-throughput sequencing data, Theoretical and Applied Genetics, 64: 137.
https://doi.org/10.1007/s00122-024-04568-2
Border R., and Becker S., 2019, Stochastic Lanczos estimation of genomic variance components for linear mixed-effects models, BMC Bioinformatics, 20: 295.
https://doi.org/10.1186/s12859-019-2978-z
Cesarani A., Pocrnić I., Macciotta N., Fragomeni B., Misztal I., and Lourenco D., 2018, Bias in heritability estimates from genomic restricted maximum likelihood methods under different genotyping strategies, Journal of Animal Breeding and Genetics, 136: 40-50.
https://doi.org/10.1111/jbg.12367
Chen X., Kuja-Halkola R., Rahman I., Arpegård J., Viktorin A., Karlsson R., Hägg S., Svensson P., Pedersen N.L., and Magnusson P.K., 2015, Dominant genetic variation and missing heritability, American Journal of Human Genetics, 97(5): 708-714.
https://doi.org/10.1016/j.ajhg.2015.10.004
Da Y., Wang C., Wang S., and Hu G., 2014, Mixed model methods for genomic prediction and variance component estimation of additive and dominance effects using SNP markers, PLoS One, 9(1): e87666.
https://doi.org/10.1371/journal.pone.0087666
Dao C., Jiang J., Paul D., and Zhao H., 2021, Variance estimation and confidence intervals from genome-wide association studies through high-dimensional misspecified mixed model analysis, Journal of Statistical Planning and Inference, 220: 15-23.
https://doi.org/10.1016/j.jspi.2022.01.003
Derbyshire M.C., Newman T.E., Thomas W.J., Batley J., and Edwards D., 2024, The complex relationship between disease resistance and yield in crops, Plant Biotechnology Journal, 22: 2612-2623.
https://doi.org/10.1111/pbi.14373
Ding Y., Hou K., Burch K., Lapinska S., Privé F., Vilhjálmsson B., Sankararaman S., and Pasaniuc B., 2021, Large uncertainty in individual polygenic risk score estimation impacts PRS-based risk stratification, Nature Genetics, 54: 30-39.
https://doi.org/10.1038/s41588-021-00961-5
Evans L.M., Tahmasbi R., Vrieze S.I., Abecasis G.R., Das S., Gazal S., Bjelland D.W., de Candia T.R., Goddard M.E., Neale B.M., Yang J., Visscher P.M., and Keller M.C., 2017, Comparison of methods that use whole genome data to estimate the heritability and genetic architecture of complex traits, Nature Genetics, 50: 737-745.
https://doi.org/10.1038/s41588-018-0108-x
Fang X.J., and Wu W.R., 2026, Evolution of statistical genetic paradigms: from linkage analysis and candidate gene strategies to GWAS, Molecular Plant Breeding, 24(9): 2817-2829.
Fang X.J., Wu W.R., and Tang J.L., (eds.), 2001, Crop DNA marker-assisted breeding, Science Press, Beijing, China, pp.1-84.
Finucane H.K., Bulik-Sullivan B., Gusev A., Trynka G., Reshef Y., Loh P.R., Anttila V., Xu H., Zang C.Z., Farh K., Ripke S., Day F.R., Consortium R., Schizophrenia Working Group of the Psychiatric Genomics Consortium, The RACI Consortium, Purcell S., Stahl E., Lindstrom S., Perry J.R.B., Okada Y., Raychaudhuri S., Daly M.J., Patterson N., Neale B.M., and Price A.L., 2015, Partitioning heritability by functional annotation using genome-wide association summary statistics, Nature Genetics, 47: 1228-1235.
https://doi.org/10.1038/ng.3404
Forni S., Aguilar I., and Misztal I., 2011, Different genomic relationship matrices for single-step analysis using phenotypic, pedigree and genomic information, Genetics Selection Evolution, 43: 1.
https://doi.org/10.1186/1297-9686-43-1
Gazal S., Loh P.R., Finucane H.K., Ganna A., Schoech, A., Sunyaev, S., and Price A.L., 2018, Functional architecture of low-frequency variants highlights strength of negative selection across coding and noncoding annotations, Nature Genetics, 50: 1600-1607.
https://doi.org/10.1038/s41588-018-0231-8
Gazal S., Weissbrod O., Hormozdiari F., Dey K., Nasser J., Jagadeesh K., Weiner D., Shi H., Fulco C., O'Connor L., Pasaniuc B., Engreitz J., and Price A., 2022, Combining SNP-to-gene linking strategies to identify disease genes and assess disease omnigenicity, Nature Genetics, 54: 827-836.
https://doi.org/10.1038/s41588-022-01087-y
Ge T., Chen C., Neale B., Sabuncu M., and Smoller J., 2016. Phenome-wide heritability analysis of the UK Biobank. PLoS Genetics, 13. https://doi.org/10.1371/journal.pgen.1006711
https://doi.org/10.1371/journal.pgen.1006711
Génin E., 2019, Missing heritability of complex diseases: case solved? Human Genetics, 139: 103-113.
https://doi.org/10.1007/s00439-019-02034-4
Granato Í., Galli G., De Oliveira Couto E., Souza M., Mendonça L., and Fritsche-Neto R., 2018, snpReady: a tool to assist breeders in genomic analysis, Molecular Breeding, 38: 84.
https://doi.org/10.1007/s11032-018-0844-8
Holland D., Frei O., Fan C., Shadrin A., Smeland O., Sundar V., Thompson P., Andreassen O., and Dale A., 2020, Beyond SNP heritability: Polygenicity and discoverability of phenotypes estimated with a univariate Gaussian mixture model, PLoS Genetics, 16(5): e1008612.
https://doi.org/10.1371/journal.pgen.1008612
Hou K., Burch K., Majumdar A., Shi H., Mancuso N., Wu Y., Sankararaman S., and Pasaniuc B., 2019, Accurate estimation of SNP-heritability from biobank-scale data irrespective of genetic architecture, Nature Genetics, 51: 1244-1251.
https://doi.org/10.1038/s41588-019-0465-0
Jang S.K., Evans L., Fialkowski A., Arnett D.K., Ashley-Koch A.E., Barnes K.C., Becker D.M., Bis J.C., Blangero J., Bleecker E.R., Boorgula M.P., Bowden D.W., Brody J.A., Cade B.E., Jenkins B.W.C., Carson A.P., Chavan S., Cupples L.A., Custer B., Damrauer S.M., David S.P., de Andrade M., Dinardo C.L., Fingerlin T.E., Fornage M., Freedman B.I., Garrett M.E., Gharib S.A., Glahn D.C., Haessler J., Heckbert S.R., Hokanson J.E., Hou L.F., Hwang S.J., Hyman M.C., Judy R., Justice A.E., Kaplan R.C., Kardia S.L.R., Kelly S., Kim W., Kooperberg C., Levy D., Lloyd-Jones D.M., Loos R.J.F., Manichaikul A.W., Gladwin M.T., Martin L.W., Nouraie M., Melander O., Meyers D.A., Montgomery C.G., North K.E., Oelsner E.C., Palmer N.D., Payton M., Peljto A.L., Peyser P.A., Preuss M., Psaty B.M., Qiao D.D., Rader D.J., Rafaels N., Redline S., Reed R.M., Reiner A.P., Rich S.S., Rotter J.I., Schwartz D.A., Shadyab A.H., Silverman E.K., Smith N.L., Smith J.G., Smith A.V., Smith J.A., Tang W.H., Taylor K.D., Telen M.J., Vasan R.S., Gordeuk V.R., Wang Z., Wiggins K.L., Yanek L.R., Yang I.V., Young K.A., Young K.L., Zhang Y.Z., Liu D.J.J., Keller M.C., and Vrieze S. 2022, Rare genetic variants explain missing heritability, Nature Human Behaviour, 6: 1577-1586.
https://doi.org/10.1038/s41562-022-01408-5
Kumar K., Feldman M. W., Rehkopf D. H., and Tuljapurkar S. (2015). Limitations of GCTA as a solution to the missing heritability problem, Proceedings of the National Academy of Sciences of the United States of America, 113(1): E61-E70.
https://doi.org/10.1073/pnas.1520109113
Mathew B., Léon J., and Sillanpää M.J., 2017, A novel linkage-disequilibrium corrected genomic relationship matrix for SNP-heritability estimation and genomic prediction, Heredity, 120: 356-368.
https://doi.org/10.1038/s41437-017-0023-4
Meyer K., 2023, Reducing computational demands of restricted maximum likelihood estimation with genomic relationship matrices, Genetics Selection Evolution (GSE), 55: 19.
https://doi.org/10.1186/s12711-023-00781-7
Ni G., Moser G., Wray N., and Lee S., 2018, Estimation of genetic correlation via linkage disequilibrium score regression and genomic restricted maximum likelihood, American Journal of Human Genetics, 102(6): 1185-1194.
https://doi.org/10.1101/194019
Nolte I., Jansweijer J., Riese H., Asselbergs F., Van Der Harst P., Spector T., Pinto Y., Snieder H., and Jamshidi Y., 2017, A comparison of heritability estimates by classical twin modeling and based on genome-wide genetic relatedness for cardiac conduction traits, Twin Research and Human Genetics, 20: 489-498.
https://doi.org/10.1017/thg.2017.55
Schmidt P., Hartung J., Bennewitz J., and Piepho H., 2019, Heritability in plant breeding on a genotype-difference basis, Genetics, 212: 991-1008.
https://doi.org/10.1534/genetics.119.302134
Speed D., and Balding D., 2018, SumHer better estimates the SNP heritability of complex traits from summary statistics, Nature genetics, 51: 277-284.
https://doi.org/10.1038/s41588-018-0279-5
Speed D., Cai N., Johnson M.R., Nejentsev S., and Balding D.J., 2016, Re-evaluation of SNP heritability in complex human traits, Nature Genetics, 49: 986-992.
https://doi.org/10.1038/ng.3865
Speed D., Hemani G., Johnson M.R., and Balding D.J., 2012, Improved heritability estimation from genome-wide SNPs, American Journal of Human Genetics, 91(6): 1011-1021.
https://doi.org/10.1016/j.ajhg.2012.10.010
Speed D., Kaphle A., and Balding D., 2022, SNP-based heritability and selection analyses: Improved models and new results, BioEssays, 44(5): 2100170.
https://doi.org/10.1002/bies.202100170
Srivastava A., Williams S., and Zhang G., 2023, Heritability estimation approaches utilizing genome-wide data, Current Protocols, 3: e734.
https://doi.org/10.1002/cpz1.734
Strandén I., Mäntysaari E., Lidauer M., Thompson R., and Gao H., 2024, A computationally efficient algorithm to leverage average information REML for (co)variance component estimation in the genomic era, Genetics Selection Evolution (GSE), 56: 18.
https://doi.org/10.1186/s12711-024-00939-x
Tang M., Wang T., and Zhang X., 2022, A review of SNP heritability estimation methods, Briefings in Bioinformatics, 23(3): bbac067.
https://doi.org/10.1093/bib/bbac067
Van Den Berg S., Vandenplas J., Van Eeuwijk F., Lopes M., and Veerkamp R., 2019, Significance testing and genomic inflation factor using high-density genotypes or whole-genome sequence data, Journal of Animal Breeding and Genetics, 136: 418-429.
https://doi.org/10.1111/jbg.12419
Vinkhuyzen A.A., Wray N.R., Yang J., Goddard M.E., and Visscher P.M., 2013, Estimation and partition of heritability in human populations using whole-genome analysis methods, Annual Review of Genetics, 47(1): 75-95.
https://doi.org/10.1146/annurev-genet-111212-133258
Wainschtein P., Jain D., Zheng Z., Aslibekyan S., Becker D., Bi W., Brody J., Carlson J., Correa A., Du M., Fernández-Rhodes L., Ferrier K., Graff M., Guo X., He J., Heard-Costa N., Highland H., Hirschhorn J., Howard-Claudio C., Isasi C., Jackson R., Jiang J., Joehanes R., Justice A., Kalyani R., Kardia S., Lange E., LeBoff M., Lee S., Li X., Li Z., Lim E., Lin D., Lin X., Liu S., Lu Y., Manson J., Martin L., McHugh C., Mikulla J., Musani S., Ng M., Nickerson D., Palmer N., Perry J., Peters U., Preuss M., Qi Q., Raffield L., Rasmussen-Torvik L., Reiner A., Russell E., Sitlani C., Smith J., Spracklen C., Wang T., Wang Z., Wessel J., Xu H., Yaser M., Yoneyama S., Young K., Zhang J., Zhang X., Zhou H., Zhu X., Zoellner S., Abe N., Abecasis G., Aguet F., Almasy L., Alonso Á., Ament S., Anderson P., Anugu P., Applebaum-Bowden D., Ardlie K., Arking D., Ashley-Koch A., Assimes T., Auer P., Avramopoulos D., Ayas N., Balasubramanian A., Barnard J., Barnes K., Barr R., Barron-Casella E., Barwick L., Beaty T., Beck G., Becker L., Beer R., Beitelshees A., Benjamin E., Benos T., Bezerra M., Bielak L., Bis J., Blackwell T., Blangero J., Bowden D., Bowler R., Broeckel U., Broome J., Brown D., Bunting K., Burchard E., Bustamante C., Buth E., Cade B., Cardwell J., Carey V., Carrier J., Carson A., Carty C., Casaburi R., Romero J., Casella J., Castaldi P., Chaffin M., Chang C., Chang Y., Chavan S., Chen B., Chen W., Cho M., Choi S., Chuang L., Chung R., Clish C., Comhair S., Conomos M., Cornell E., Crandall C., Crapo J., Curran J., Curtis J., Custer B., Damcott C., Darbar D., David S., Davis C., Daya M., De Las Fuentes L., De Vries P., DeBaun M., Deka R., Demeo D., Devine S., Dinh H., Doddapaneni H., Duan Q., Dugan-Perez S., Duggirala R., Durda J., Dutcher S., Eaton C., Ekunwe L., Boueiz E., Emery L., Erzurum S., Farber C., Farek J., Fingerlin T., Flickinger M., Franceschini N., Frazar C., Fu M., Fullerton S., Fulton L., Gabriel S., Gan W., Gao S., Gao Y., Gass M., Geiger H., Gelb B., Geraci M., Germer S., Gerszten R., Ghosh A., Gibbs, R., Gignoux C., Gladwin M., Glahn D., Gogarten S., Gong D., Goring H., Graw S., Gray K., Grine D., Gross C., Gu C., Guan Y., Gupta N., Haas D., Haessler J., Hall M., Han Y., Hanly P., Harris D., Hawley N., Heavner B., Herrington D., Hersh C., Hidalgo B., Hixson J., Hobbs B., Hokanson J., Hong E., Hoth K., Hsiung C., Hu J., Hung Y., Huston H., Hwu C., Irvin M., Jaquish C., Johnsen J., Johnson A., Johnson C., Johnston R., Jones K., Kang H., Kaplan R., Kelly S., Kenny E., Kessler M., Khan A., Khan Z., Kim W., Kimoff J., Kinney G., Konkle B., Kramer H., Lange C., Lee J., Lee S., Lee W., Lefaive J., Levine D., Levy D., Lewis J., Li Y., Lin H., Lin H., Liu Y., Lunetta K., Luo J., Magalang U., Mahaney M., Make B., Manichaikul A., Manning A., Marton M., Mathai S., May S., McArdle P., McFarland S., McGoldrick D., McNeil B., Mei H., Meigs J., Menon V., Mestroni L., Metcalf G., Meyers D., Mignot E., Min N., Minear M., Minster R., Moll M., Momin Z., Montasser M., Montgomery C., Muzny D., Mychaleckyj J., Nadkarni G., Naik R., Naseri T., Natarajan P., Nekhai S., Nelson S., Neltner B., Nessner C., Nkechinyere O., O'Connor T., Ochs-Balcom H., Okwuonu G., Pack A., Paik D., Pankow J., Papanicolaou G., Parker C., Peloso G., Peralta J., Perez M., Peyser P., Phillips L., Pleiness J., Pollin T., Post W., Becker J., Boorgula M., Qasba P., Qiao D., Qin Z., Rafaels N., Rajendran M., Rao D., Ratan A., Reed R., Reeves C., Reupena M., Rice K., Robillard R., Robine N., Roselli C., Ruczinski I., Runnels A., Russell P., Ruuska S., Ryan K., Sabino E., Saleheen D., Salimi S., Salvi S., Salzberg S., Sandow K., Sankaran V., Santibanez J., Schwander K., Schwartz D., Sciurba F., Seidman C., Seidman J., Sheehan V., Sherman S., Shetty A., Shetty A., Sheu W., Silver B., Silverman E., Skomro R., Smith A., Smith T., Smoller S., Snively B., Snyder M., Sofer T., Sotoodehnia N., Stilp A., Storm G., Streeten E., Su J., Sung Y., Sylvia J., Szpiro A., Taliun D., Tang H., Taub M., Taylor K., Taylor M., Taylor S., Telen M., Thornton T., Threlkeld M., Tinker L., Tirschwell D., Tishkoff S., Tiwari H., Tong C., Tracy R., Tsai M., Vaidya D., Van Den Berg D., Vandehaar P., Vrieze S., Walker T., Wallace R., Walts A., Wang F., Wang H., Wang J., Watson K., Watt J., Weeks D., Weinstock J., Weiss S., Weng L., Willer C., Williams K., Williams L., Wilson C., Wilson J., Winterkorn L., Wong Q., Wu J., Yang I., Yu K., Zekavat S., Zhang Y., Zhao S., Zhao W., Zody M., Cupples L., Shadyab A., McKnight B., Shoemaker B., Mitchell B., Psaty B., Kooperberg C., Liu C., Albert C., Roden D., Chasman D., Darbar D., Lloyd‐Jones D., Arnett D., Regan E., Boerwinkle E., Rotter J., O'Connell J., Yanek L., De Andrade M., Allison M., McDonald M., Chung M., Fornage M., Chami N., Smith N., Ellinor P., Vasan R., Mathias R., Loos R., Rich S., Lubitz S., Heckbert S., Redline S., Guo X., Chen Y., Laurie C., Hernandez R., McGarvey S., Goddard M., Laurie C., North K., Lange L., Weir B., Yengo L., Yang J., and Visscher P., 2022, Assessing the contribution of rare variants to complex trait heritability from whole-genome sequence data, Nature Genetics, 54: 263-273.
Wang S., Wei Y., Liu D., Zhang X., Wang Q., Pan Y., and Ma P., 2025, Impact of different genomic relationship matrix construction methods on the accuracy of genomic prediction in different species, Frontiers in Genetics, 16: 1576248.
https://doi.org/10.3389/fgene.2025.1576248
Wang X., Walker A., Revez J., Ni G., Adams M., McIntosh A., Visscher P., Wray N., Ripke S., Mattheisen M., Trzaskowski M., Byrne E., Abdellaoui A., Agerbo E., Air T., Andlauer T., Bacanu S., Bækvad-Hansen M., Beekman A., Bigdeli T., Binder E., Bryois J., Buttenschøn H., Bybjerg-Grauholm J., Cai N., Christensen J., Clarke T., Coleman J., Colodro-Conde L., Couvy-Duchesne B., Craddock N., Crawford G., Davies G., Degenhardt F., Derks E., Direk N., Dolan C., Dunn E., Eley T., Escott-Price V., Kiadeh F., Finucane H., Foo J., Forstner A., Frank J., Gaspar H., Gill M., Goes F., Gordon S., Grove J., Hall L., Hansen C., Hansen T., Herms S., Hickie I., Hoffmann P., Homuth G., Horn C., Hottenga J., Hougaard D., Howard D., Ising M., Jansen R., Jones I., Jones L., Jorgenson E., Knowles J., Kohane I., Kraft J., Kretzschmar W., Kutalik Z., Li Y., Lind P., Macintyre D., MacKinnon D., Maier R., Maier W., Marchini J., Mbarek H., McGrath P., McGuffin P., Medland S., Mehta D., Middeldorp C., Mihailov E., Milaneschi Y., Milani L., Mondimore F., Montgomery G., Mostafavi S., Mullins N., Nauck M., Ng B., Nivard M., Nyholt D., O'Reilly P., Oskarsson H., Owen M., Painter J., Pedersen B., Pedersen M., Peterson R., Peyrot W., Pistis G., Posthuma D., Quiroz J., Qvist P., Rice J., Riley B., Rivera M., Mirza S., Schoevers R., Schulte E., Shen L., Shi J., Shyn S., Sigurdsson E., Sinnamon G., Smit J., Smith D., Stefánsson H., Steinberg S., Streit F., Strohmaier J., Tansey K., Teismann H., Teumer A., Thompson W., Thomson P., Thorgeirsson T., Traylor M., Treutlein J., Trubetskoy V., Uitterlinden A., Umbricht D., Van Der Auwera S., Van Hemert A., Viktorin A., Wang Y., Webb B., Weinsheimer S., Wellmann J., Willemsen G., Witt S., Wu Y., Xi H., Yang J., Zhang F., Arolt V., Baune B., Berger K., Boomsma D., Cichon S., Dannlowski U., De Geus E., DePaulo J., Domenici E., Domschke K., Esko T., Grabe H., Hamilton S., Hayward C., Heath A., Kendler K., Kloiber S., Lewis G., Li Q., Lucae S., Madden P., Magnusson P., Martin N., Metspalu A., Mors O., Mortensen P., Müller-Myhsok B., Nordentoft M., Nöthen M., O'Donovan M., Paciga S., Pedersen N., Penninx B., Perlis R., Porteous D., Potash J., Preisig M., Rietschel M., Schaefer C., Schulze T., Smoller J., Stefansson K., Tiemeier H., Uher R., Völzke H., Weissman M., Werge T., Lewis C., Levinson D., Breen G., Børglum A., and Sullivan P., 2023, Polygenic risk prediction: why and when out-of-sample prediction R2 can exceed SNP-based heritability, American Journal of Human Genetics, 110(7): 1207-1215.
https://doi.org/10.1016/j.ajhg.2023.06.006
Wei J., Xie W., Li R., Wang S., Qu H., Ma R., Zhou X., and Jia Z., 2020, Analysis of trait heritability in functionally partitioned rice genomes, Heredity, 124(3): 485-498.
https://doi.org/10.1038/s41437-019-0244-9
Weissbrod O., Hormozdiari F., Benner C., Cui R., Ulirsch J., Gazal S., Schoech A., Van De Geijn B., Reshef Y., Márquez-Luna C., O'Connor L., Pirinen M., Finucane H., and Price A., 2019, Functionally-informed fine-mapping and polygenic localization of complex trait heritability, Nature Genetics, 52: 1355-1363.
https://doi.org/10.1038/s41588-020-00735-5
Yang J., Bakshi A., Zhu Z., Hemani G., Vinkhuyzen A.A.E., Lee S.H., Robinson M.R., Perry J.R.B., Nolte I.M., van Vliet-Ostaptchouk J.V., Snieder H., Esko T., Milani L., Mägi R., Metspalu A., Hamsten A., Magnusson P.K.E., Pedersen N.L., Ingelsson E., Soranzo N., Keller M.C., Wray N.R., Goddard M.E., Visscher P.M., 2015, Genetic variance estimation with imputed variants finds negligible missing heritability for human height and body mass index, Nature Genetics, 47: 1114-1120.
https://doi.org/10.1038/ng.3390
Yang J., Lee S., Wray N., Goddard M., and Visscher P., 2016, GCTA-GREML accounts for linkage disequilibrium when estimating genetic variance from genome-wide SNPs, Proceedings of the National Academy of Sciences (PNAS), 113(32): E4579-E4580.
https://doi.org/10.1073/pnas.1602743113
Yang J., Lee S.H., Goddard M.E., and Visscher P.M., 2011, GCTA: A tool for genome-wide complex trait analysis, American Journal of Human Genetics, 88(1): 76-82.
https://doi.org/10.1016/j.ajhg.2010.11.011
Yang J., Zeng J., Goddard M.E., Wray N.R., and Visscher P.M., 2017, Concepts, estimation and interpretation of SNP-based heritability, Nature Genetics, 49: 1304-1310.
https://doi.org/10.1038/ng.3941
Zhang Y., Qi G., Park J., and Chatterjee N., 2018, Estimation of complex effect-size distributions using summary-level statistics from genome-wide association studies across 32 complex traits, Nature Genetics, 50: 1318-1326.
https://doi.org/10.1038/s41588-018-0193-x
Zhou X., Im H., and Lee S., 2019, CORE GREML: Estimating covariance between random effects in linear mixed models for genomic analyses of complex traits, bioRxiv, 2019: 853515.
https://doi.org/10.1101/853515
Zhou X., Im H., and Lee S., 2020, CORE GREML for estimating covariance between random effects in linear mixed models for complex trait analyses, Nature Communications, 11: 4203.
https://doi.org/10.1038/s41467-020-18085-5
Zhu H., and Zhou X., 2020, Statistical methods for SNP heritability estimation and partition: A review, Computational and Structural Biotechnology Journal, 18: 1557-1568.
https://doi.org/10.1016/j.csbj.2020.06.011
Zhu Z., Bakshi A., Vinkhuyzen A.A., Hemani G., Lee S.H., Nolte I.M., van Vliet-Ostaptchouk J.V., Snieder H., The LifeLines Cohort Study, Esko T., Milani L., Magi R., Metspalu A., Hill W.G., Weir B.S., Goddard M.E., Visscher P.M., and Yang J., 2015, Dominance genetic variation contributes little to the missing heritability for human complex traits, The American Journal of Human Genetics, 96(3): 377-385.
https://doi.org/10.1016/j.ajhg.2015.01.001
Appendix A. Checklist for Interpreting SNP-based Heritability Estimates under the GREML Framework
This checklist is intended to standardize the interpretation workflow of SNP-based heritability estimates derived from the GREML framework, emphasizing their dependence on data quality, model specification, and underlying statistical assumptions. Researchers may use this checklist to systematically verify each step of the analysis, thereby improving the transparency and reproducibility of inference.
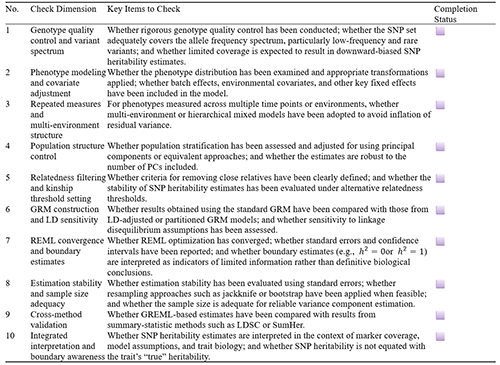 Table S1 Interpretation of SNP heritability estimates followed a standardized checklist |
Appendix B. Comparative Summary of Statistical Objectives, Assumptions, and Applicability of GREML Extensions and Variants
Supplementary Table 2 summarizes the differences among commonly used extensions of the GREML framework in terms of their statistical objectives, core assumptions, applicable data structures, and key diagnostic considerations. This comparison table is intended to provide guidance for selecting appropriate extended models under different research scenarios.
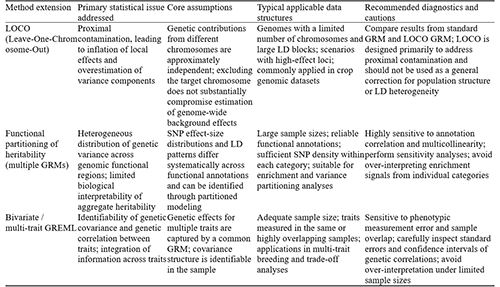 Table S2 Statistical Objectives, Assumptions, and Applicability of GREML Extensions and Variants |


. FPDF(win)
. FPDF(mac)
. HTML
. Online fPDF
Associated material
. Readers' comments
Other articles by authors
. Xuanjun Fang
Related articles
. SNP heritability
. Genome-wide relationship matrix (GRM)
. GCTA-GREML
. Missing heritability
. Statistical interpretation
. Diagnostic workflow
Tools
. Post a comment