Research Article
Physiological Indicators of Salinity Tolerance in Four Rice (Oryza sativa L.) Cultivars 
 Author
  Correspondence author
Bioscience Methods, 2016, Vol. 7, No. 3 doi: 10.5376/bm.2016.07.0003
Received: 16 Jun., 2016 Accepted: 06 Dec., 2016 Published: 22 Dec., 2016
Ologundudu A.F., and Ajayi A.T., 2016, Physiological indicators of salinity tolerance in four rice (Oryza sativa L.) Cultivars, Bioscience Methods, 7(3): 1-11 (doi: 10.5376/bm.2016.07.0003)
The study investigated the physiological indicators of salinity tolerance in four rice (Oryza sativa L.) cultivars with the aim of identifying the critical threshold of responses to different salts and different growth stages. Rice seeds were sown in ninety six plastic pots and the seedlings were divided into two salinity treatment of NaCl and Na2SO4 at three different concentrations (5, 10 and 15 ds/m) respectively while distilled water served as the control. A factorial experiment (4 x 4 x 2 x 3) laid out in a Randomized Complete Block Design (RCBD) was used. Treatments were applied at the vegetative, flowering and grain-filling stages. The seedlings were raised in a screenhouse under normal environmental conditions. Sampling was done two weeks after salinization and at one week interval. The result of the growth parameters studied revealed that growth was inhibited for all varieties at the highest salinity concentrations in both treatments. The growth analysis which was more enhanced under Na2SO4 than NaCl, attributed to the more intense inhibitory effect of NaCl more than Na2SO4 to water uptake, distribution of essential mineral nutrients thereby interfering with metabolic processes such as photosynthesis and protein synthesis.
Introduction
Salinity is generally defined as the presence of excessive amount of soluble salts in the soil solution (Sotiroupolous, 2007). It has become a very serious problem for crop production particularly in arid and semi-arid regions (Archibold, 1995). There are two main types of salinity based on their sources: Primary salinity which results from weathering of minerals and soil derived from saline parent rock (Ashraf, 2004), while secondary salinity is caused by human interference such as irrigation, deforestation, fertilizer application, overgrazing or intensive cropping (Sposito, 1989; Ashraf, 2004). Soil salinization is a serious problem in the entire world and it has grown substantially causing loss in crop productivity (Fao, 2000). It is a major constraint limiting agricultural productivity on nearly 20% of the cultivated and irrigated area worldwide (Zheng et al., 2001). Salinity affects almost every aspect of the physiology and biochemistry of plants and significantly reduces yield. High exogenous salt concentrations affect seed germination, water deficit, ion imbalance of the cellular ions resulting in ion toxicity and osmotic stress (Khan and Panda, 2008). Salt stress has been reported to cause an inhibition of growth and development, reduction in photosynthesis, respiration and protein synthesis in sensitive species (Meloni et al., 2003; Pal et al., 2004).
The most important process that is affected in plants growing under saline conditions is photosynthesis. Reduced photosynthesis under salinity is not only attributed to stomata closure leading to a reduction in intercellular CO2 concentration, but also to non-stomata factors. There is strong evidence that salt affects photosynthetic enzymes, chlorophylls and carotenoids (Stepien and Klobus, 2006). Salt also affects photosynthetic parameters, including osmotic and leaf water potential, transpiration rate, leaf temperature, and relative leaf water content (Ashraf and Foolad, 2007). Salt tolerance is generally a sustained growth of the plant in the soil environment impregnated with NaCl or other salt combinations (Mori et al., 2006).
Early studies conducted under controlled conditions reported that salt injury in rice plant is caused by both osmotic imbalance and accumulation of chloride ions (Clarkson and Hanson, 1980). Recent studies however, indicated that injury is due to the excessive sodium (Na) uptake, and chloride, being essentially a neutral anion, is tolerated over a wide range of concentrations (Clarkson and Hanson, 1980). Na-K imbalance adversely affects grain yield (Devitt and Grieve, 1981). The typical mechanism of salinity tolerance in rice is the exclusion or reduction of Na uptake and increased absorption of K to maintain a good Na-K balance in the shoot.
There are extensive studies of salinity effects on rice based on NaCl as a predominant salt. The understanding of the quantitative effects of salinity on rice and critical thresholds of responses, especially with respect to the different salt and growth stages is still limited. Hence, this study investigated the effect of salinity stress on some physiological traits with the aim of developing information templates for other cultivars in future breeding programmes.
1 Materials and Methods
1.1 Experimental varieties
Seeds of four different rice varieties; IR20, IR29, NERICA1 and POKKALLI (a salt tolerant check) were utilized in the experiment. The cultivars were collected from the African Rice Centre, International Institute of Tropical Agriculture (IITA), Ibadan, Nigeria.
1.2 Source of soil
The soil was collected behind the Department of Botany, Obafemi Awolowo University, Ile-Ife.
2 Pre planting Analysis
The soil was analyzed at the Department of Soil Science, Faculty of Agriculture, Obafemi Awolowo University, Ile-Ife. The following physical and chemical properties of the soil were determined: particle size distribution (sand, silt and clay) and textural class, pH, organic carbon, organic matter, total nitrogen, available phosphorus, calcium, magnesium, potassium, sodium, exchangeable acidity and effective cation exchange capacity. The soil was then air dried and then transferred into 72 plastic pots (about 21 cm in diameter and 17 cm in depth) each with three holes of approximately 3 mm in diameter bored at the bottom to enhance drainage during the course of the experiment.
3 Screenhouse Experiment
This experiment was conducted in the screenhouse. This is to protect the plants from direct rainfall contaminations, trampling and to avoid being destroyed by rodents as the plants develop. The average daily temperature, relative humidity and light intensity were also taken and recorded.
3.1 Preparation of salt solution
Salinity levels using pure salts was prepared with the following equation: EC = TDS/640 (Meot-Duros and Magne, 2008)
EC = Electrical conductivity
TDS = Concentration of soluble salts in mg/L
3.2 Nutrient solution preparation and salinization
Nutrient solution was prepared following the method described by Yoshida et al. (1976) and was salinized by adding NaCl and Na2SO4 at various concentrations.
3.3 Experimental design
A factorial experiment (4 x 4 x 2 x 3) laid out in a randomized complete block design (RCBD) was used. Factors of the experiment include Salt type (NaCl and Na2SO4), Salinity concentration (0, 5, 10 and 15 ds/m) while distilled water (0 ds/m) served as the control, Rice cultivars (IR20, IR29, POKKALI and NERICA 1) and growth stages (vegetative, flowering and grain-filling).
3.4 Application of nutrient solution
Each pot was supplied with 200 ml of appropriate nutrient in the morning and 200 ml of distilled water in the evening until the period of salinization. Plants were grown up to 14 d in normal nutrient solution to allow for sufficient growth before salinization. Sampling was done two weeks after salinity and at one week interval.
4 Determination of Germination Parameter
Speed of Germination (SG) and Final Germination Percent (FG%) was calculated following the procedure of Ellis and Robert (1981) and Ruan et al. (2002).
SG = N1/D1+N2/D2+…..+Ni/Di (Ellis and Robert, 1981).
FG% = S/T X 100 (Ruan et al., 2002).
Where, S is the number of germinated seeds, T is the total number of seeds and Ni is the number of germinated seeds per day (Di).
5 Measurement of Morphological Parameters
The following qualitative and quantitative morphological characters will be determined from the study.
5.1 Plant height
The seedlings were tagged and the main culms were measured at interval of 14 days using the metre rule. Plant height was measured from the base of the plant (top of the soil) to the tip of the tallest leaf.
5.2 Determination of root and shoot dry weight
Seedling shoot of ten randomly selected seedlings from each replication will be measured at the time of harvest (14 days after treatment application) with a metre rule. Shoot dry weight and root dry weight (10 seedlings) was recorded after oven drying at 90°C for 3 days
6 Relative Growth Rate (RGR)
RGR= 1/Ws x dWs/dt, where Ws is plant dry weight, dWs is change in dry weight and dt is time interval
This measured the dry matter accumulated at a particular time regardless of the assimilatory surface present; measured in g/d (Evans, 1972).
7 Leaf Weight Ratio (LWR)
LWR = W1/WS
LWR defines assimilation in terms of leaf density: the unit is g-1 . W1 is the leaf dry weight and Ws is plant dry weight at harvest.
8 Results
8.1 Threshold of salinity tolerance
Threshold of salinity tolerance of four rice (Oryza sativa L.) cultivars across different salts is shown in Figure 1. Threshold (critical limit of salinity tolerance) for NaCl is at salinity concentration of 10 ds/m while that of Na2SO4 is at 5 ds/m. Beyond these limits, there is a reduction in the tolerance level of the cultivars across the different salts.
|
Figure 1 Threshold of Salinity Tolerance at Germination Stage of Four Rice (Oryza sativa L.) cultivars for A (NaCl) and B (Na2SO4) |
.png)
8.2 Final germination percentage (FGP)
In the salt free regime, the germination percentages of all varieties were greater than 90% under both salinity treatments (Table 1). At the salinity level of 5 ds m-1, under Na2SO4 treatment, a higher germination percentage of more than 90% was observed from the varieties IR 20 and POKALLI, which were statistically similar with two other varieties, NERICA1 and POKKALI under NaCl treatment.
|
Table 1 Effect of Salinity Stress on Germination Percentage of Different Rice Varieties
Note: Means with the same letter in the columns do not differ significantly (P≤0.05)
|
.jpg)
8.3 Growth traits
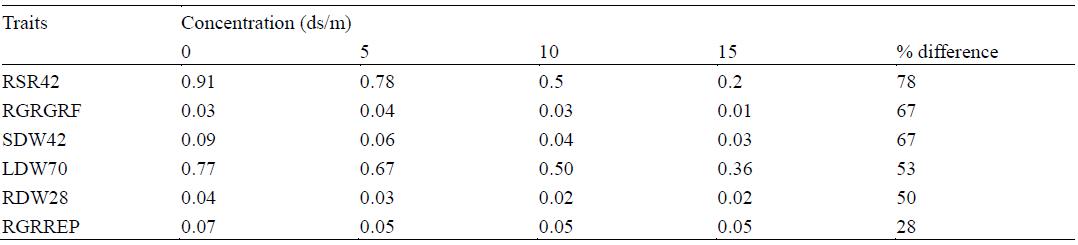
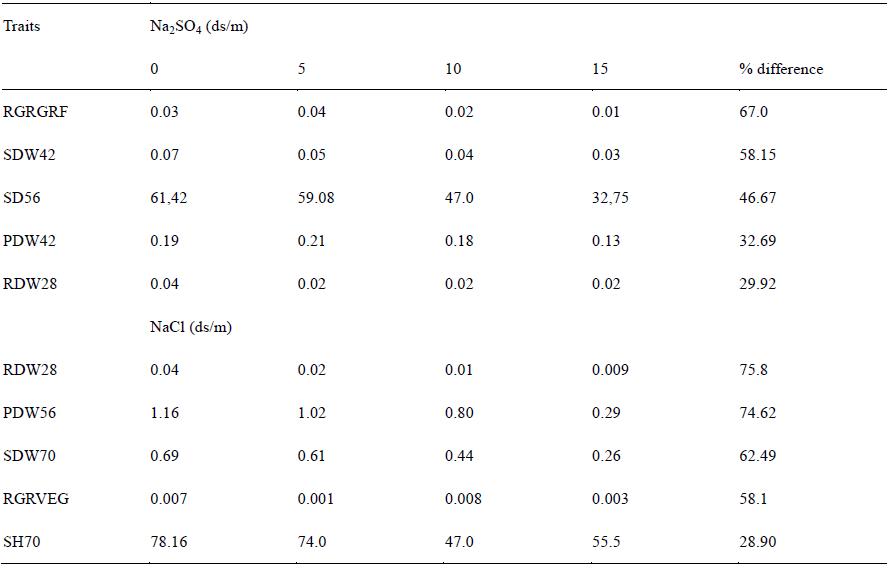
Means of some growth traits under different concentrations of the two salts across four rice varieties for salinity tolerance is shown in Table 2. Percentage difference among the growth traits ranges from 28-78% respectively. The greatest reduction was observed in root shoot ratio (RSR42) at the 42nd day (vegetative stage). Means of some growth traits under different concentrations of NaCl and Na2SO4 salts across four rice varieties for salinity tolerance is shown in Table 3. The greatest reduction of 67% was observed in relative growth rate at the grain filling stages under Na2SO4 treatment. The means of the growth traits reduce with increase in salinity levels. Shoot dry weight (SDW) was greatly reduced at the vegetative stage (42nd day) while shoot height reduction occurs at the reproductive stage (56th day).
|
Table 2 Means of some growth traits under different concentrations of two salts across four rice varieties for salinity tolerance
Note: Means with the same letter in the columns do not differ significantly (P≤0.05); Root shoot ratio at 42nd day (RSR42); Relative growth rate at Grain Filling Stage (RGRGRF); Shoot dry weight at 42nd day (SDW42); Leaf dry weight at 70th day (LDW70); Root dry weight at 28th day (RDW28); Relative growth Rate at reproductive stage (RGRREP); Leaf weight ratio at 35th day (LWR35)
|
|
Table 3 Means of Some Growth Traits under Different Concentrations of NaCl and Na2SO4 Across Four Rice Varieties for Salinity Tolerance |
8.4 Shoot height
There was a gradual increase in the shoot height of the four rice cultivars under salt free condition from the 28th day till the end of the experiment (Figure 2). In addition, the shoot heights of IR20, POKKALI and IR29 followed similar trend with a steady increase between the 28th and 42nd day (vegetative stage) and with heights ranging between 32 cm and 52 cm respectively. Figure 3 shows the shoot heights of rice cultivars under stress (5 ds/m). the shoot heights of IR29 (70 cm) and NERICA 1 (55 cm) were significantly higher under NaCl treatment as compared with Na2SO4 treatment where no significant effects were observed. POKKALI recorded the highest shoot height of approximately 92 cm under NaCl treatment. All the rice cultivars reached their peak on the 70th day. Similar trends were observed in the shoot heights of the cultivars under both treatments. However, unlike at 5 ds/m, the shoot heights of IR29 (70 cm) and NERICA 1 (62 cm) were significantly higher under Na2SO4 stress at 10 ds/m as compared with NaCl stress (Figure 4). The shoot heights of NERICA 1 (30 cm) were significantly lower under NaCl and Na2SO4 treatment (Figure 5). However, IR20, POKKALI and IR29 followed similar trend in their growth pattern.
|
Figure 2 Shoot height of four rice cultivars evaluated under salt free conditions (±S.E) |
.png)
|
Figure 3 Shoot height of four rice cultivars under stress (5 ds/m) and evaluated in the screenhouse under concentrations of (A) NaCl and (B) Na2SO4 (±S.E) |
.png)
|
Figure 4 Shoot height of four rice cultivars under stress (10 ds/m) and evaluated in the screenhouse under concentrations of (A) NaCl and (B) Na2SO4 (±S.E) |
.png)
|
Figure 5 Shoot height of four rice cultivars under stress (15 ds/m) and evaluated in the screenhouse under concentrations of (A) NaCl and (B) Na2SO4 (±S.E) |
.png)
8.5 Fresh weight
There was a rapid increase in the fresh weight of POKKALI under salt free condition from the 28th day until maximum fresh weight of approximately 22 g was attained on the 63rd day during the grain filling stage (Figure 6). Rice cultivars growing in 5 ds/m Na2SO4 promoted better fresh weight than NaCl stress and there were continuous increase in the fresh weight of rice cultivars under NaCl and Na2SO4 stresses (5 ds/m) until maximum fresh weights were attained (Figure 7). IR29 attained a maximum fresh weight of about 6 g on the 56th day (reproductive stage) while IR20 and NERICA 1 recorded fresh weights of approximately 6.5 g on the 49th day (vegetative stage). This was followed by sharp decreases till the end of the experiment. However, under Na2SO4 treatment, significant difference in the fresh weight of IR29 was observed between the 49th and 63rd day. This was followed by a sharp decrease till the end of the experimental period. Similar patterns of fresh weight increases were found in 10 and 15 ds/m of the Na salts throughout the experiment (Figures 8; Figure 9). IR20 recorded a fresh weight of approximately 7.2 g on the 42nd day (vegetative stage). However, a fresh weight of approximately 8 g was recorded in IR29 and NERICA 1 on the 63rd day (grain filling stage). IR20 (NaCl) and IR29 (Na2SO4) at 15 ds/m stresses showed exceptional fresh weight increases at 56th day than other treatments.
|
Figure 6 Fresh weight of four rice cultivars evaluated in the screenhouse under salt free conditions (±S.E) |
.png)
|
Figure 7 Fresh weight of four rice cultivars under stress (5 ds/m) and evaluated in the screenhouse under concentrations of (A) NaCl and (B) Na2SO4 (±S.E) |
.png)
|
Figure 8 Fresh weight of four rice cultivars under stress (10 ds/m) and evaluated in the screenhouse under concentrations of (A) NaCl and (B) Na2SO4 (±S.E) |
.png)
|
Figure 9 Fresh weight of four rice cultivars under stress (15 ds/m) evaluated in the screenhouse under concentrations of (A) NaCl and (B) Na2SO4 (±S.E) |
.png)
9 Discussions
Threshold is intuitively a critical parameter for assessing plant salt tolerance differs across salt. Cultivars that are subjected to NaCl stress had their critical limit at 10 ds/m while the threshold of Na2SO4 is 5 ds/m. Hence, tolerance level of rice cultivars differs across salt and plant developmental stages. Beyond these limits, there is a considerable change in the response level from tolerance to sensitivity.
The most critical stage in seedling establishment is usually considered as seed germination which consequently determines the successful crop production (Khan et al., 2005). Understanding the responses of plants at these critical stages is particularly important for elucidating the mechanisms of salt resistance or sensitivity in plants and their survival. In this study, germination was completely inhibited for all varieties (POKKALI, IR 20, IR 29 and NERICA 1) at higher salinity concentrations of 15 ds/m in both treatments (NaCl and Na2SO4). Inhibition of germination due to salinity as suggested in previous reports (Kumer et al., 2009) was attributed to a decrease in water content that affected the synthesis of hydrolytic enzymes limiting the hydrolysis of food reserves from storage tissues to the developing embryo. The result of these findings is also in conformity with the report of Ashraf et al. (2000), that salinity stress reduced the rate of germination due to reduced water potential and slower rate of imbibition. Salinity alters the imbibition of water by seeds due to lower osmotic potential of germination media (Khan et al., 2005), causes toxicity which changes the activity of enzymes of nucleic acid metabolism (Bor et al., 2003), disturbs hormonal balance and reduces the utilization of seed reserves (Carden et al., 2010). Seed germination is one of the most fundamental and vital phases in the growth cycle of plants that determine plant establishment and the yield of crops. High level of salt stress inhibits the germination of seeds while lower level of salinity induces a state of dormancy (Joseph et al., 2010). The decreasing tendency of speed of germination (SG) due to increasing salinity was in conformity with the reports of others (Khan et al., 2005; James et al., 2000). Parida and Das (2005), reported that the reduction of SG at high salt levels might be mainly due to osmotic stress. Also, Parida and Das (2005) opined that salinity reduces plant growth due to osmotic stress and ionic effects on soil solution. However Mistra et al. (2005) was of the opinion that high accumulation of sodium ions (Na+) in saline soils causes lowering of water potential and thus makes the plant unable to extract water from soil due to osmotic stress. Meanwhile, this study did not conform to the result of Joseph et al. (2010) which reported that seed germination did not occur at 15 ds/m. The variability in salinity tolerance among rice varieties at germination have been reported (Hodges, 2003; Parida and Das, 2005). IR 20 had high germination percent (GP) but low germination energy percent (GE%) which possibly suggest that the seeds might had germinated earlier. However, the varieties with high GE% value in both treatments at specific salinity level obviously would be of higher competitive advantage than other varieties having lower GE% value for capturing environmental and edaphic resources. Even though salinity delays germination, higher salt concentrations will eventually reduce the percentage of germinated seeds (Haq et al, 2002).
Reduction in seedling height is a common phenomenon of many crop plants grown under saline conditions (Hasegewa, 2000). Also plant height under Na2SO4 was more suppressed than plant height under NaCl at each specific salt concentration level in both treatments. This however does not conform to the report of Ramohya et al. (2004). Islam et al. (2003) also observed the differences in plant height of rice varieties with different salinity levels. The higher plant height observed in IR20 under both treatments as compared to other varieties might be due to more inhibitory effect of NaCl salinity to root growth compared to that of shoot (Gong et al., 2006). Grant et al. (2000) earlier reported that plant height progressively decreased with increase in salinity levels because high concentration of soluble salt in soil and osmotic pressure creates disturbance in uptake of water and other nutrients. Ghoilam et al. (2002) reported that high salinity may inhibit the root and shoot elongation due to slowing down the water uptake by the plant. Also Gama et al., 2007 indicated that salinity can rapidly inhibit the root growth and its capacity to water uptake and essential mineral nutrition from soil. However the inhibition of root and shoot elongation as reported by Khan et al. (2005) were based on NaCl salinity. Meanwhile, in this study, shoot height elongations were more pronounced under NaCl than Na2SO4 treatment. This could be due to the more inhibitory effect of NaCl than Na2SO4 to water uptake and distribution of essential mineral nutrients. Flowers (2004) reported that the reduction in root and shoot development may be due to toxic effects of NaCl as well as unbalanced nutrient uptake by the seedlings. Saline conditions inhibit plant growth to variable extent either by reducing plant osmotic potential or because of specific ion toxicity (Flowers et al., 1991). The observed reduction in plant height of NERICA1 in both treatments might be might be due to decrease in water potential, high ion concentrations of Na+, Cl- and SO42- accumulation in leaves interfering metabolic processes; photosynthesis and protein synthesis. Higher concentrations of these ions in the root zone suppressed the uptake of other essential ions like K+ and Ca2+ thus resulting in reduced plant growth (Fedoroff, 2006). Significant reduction in plant height for various cultivars exposed to salinity levels was also reported by Khan et al. (2005). Thus, salt stress application had overall substantial negative effect on all visual growth parameters.
Root and shoot growth of all rice cultivars measured in terms of fresh weight and dry weight were considerably reduced at the grain filling stages. The findings in this study revealed that rice roots and shoot exhibited significant reductions under stress.
10 Conclusions
In this study, germination was completely inhibited for all varieties at the highest salinity concentrations in both treatments. This was attributed to a decrease in osmotic potential that affected the synthesis of hydrolytic enzymes limiting the hydrolysis of food reserves from storage tissues to the developing embryo. Specifically, IR20 had a higher germination percent than other cultivars. Growth analysis revealed that the cultivars tolerated Na2SO4 more than NaCl.
This study concludes that different traits are responsible for salinity tolerance in rice cultivars subjected to different salinity stress.
Acknowledgement
I wish to acknowledge the painstaking efforts of my supervisors; Prof. A. A. Adelusi and Dr. R. O. Akinwale, both of Obafemi Awolowo University, Ile-Ife, Nigeria, for guiding me through the course of this study.
Achibold, 1995, The effect of salt stress on lipid peroxidation and antioxidants in the leaf of the cultivated tomato and its wild salt-tolerant relative Lycopersicon pennellii., Plant Physiology, 104: 169-174
Amirjani M., 2010, Effect of salinity stress on growth, sugar content, pigments and enzyme activity of rice, International Journal of Botany, 7: 73-81
Ashraf M., 2004, Photosynthesis and PSII functionality of drought-resistant and drought Sensitive weeping love grass plants, Journal of Experimental Botany, 49: 135-144
Ashraf M., and Foolad P.J., 2007, Pontential biochemical indicators of salinity tolerance in plants, Plant Science, 166: 3-16
https://doi.org/10.1016/j.plantsci.2003.10.024
Ashraf M.Y., and Bhatti A.S., 2000, Effect of salinity on growth and chlorophyll content in rice, Pakistian Journal of Inustrial Research, 43: 130-131
Bor M.F., and Turkan L., 2003, The effect of salt stress on lipid peroxidation and antioxidants in leaves of sugar beet Beta vulgaris L. and wild beet Beta maritime, Plant Science, 160: 837-845
Carden D.E., Walker D.J., and Flowers A.J., 2010, Single-cell measurements contributions of cytosolic Na+ and K+ to salt tolerance, Plant Physiology, 155: 646-651
Clarkson A.H., and Hanson R.B., 1980, Effect of sodium chloride salinity on seedling emergence in chickpea, Journal of Agronomy and Crop Science, 188: 155-160
Devitt E.V., and Grieve C.M., 1981, Sodium-induced calcium deficiency in salt-stressed corn, Plant Cell Environment, 10: 559-564
Fedoroff N., 2006, Redox regulatory mechanisms in cellular stress responses, Annals of Botany, 98: 289-300
https://doi.org/10.1093/aob/mcl128
Flowers T.J., 2004, Rapid and tissue-specific accumulation of solutes in the growth zone of barley leaves in response to salinity, Planta, 219: 515-525
Flowers T.J., Hajibagheri M.A., and Yeo A.R., 1991, Ion accumulation in the cell walls of rice plants growing under saline conditions: evidence for the Oertli hypothesis, Plant Cell Environment, 14: 319-325
https://doi.org/10.1111/j.1365-3040.1991.tb01507.x
Gama P.B., Inanaga S., Tanaka K., and Nakazawa R., 2007, Physiological response of common bean (Phaseolus Vulg. L.) seedlings to salinity stress, African Journal of Biotechnology, 6: 79-88
Ghoulam C.A., and Fares K., 2002, Effects of salt stress on growth, inorganic ions and proline accumulation in relation to osmotic adjustment in five beet cultivars, Environment and Experimental Botany, 47: 39-50
https://doi.org/10.1016/S0098-8472(01)00109-5
Gong H.J., Randall D.P., and Flowers T.J., 2006, Silicon deposition in the root reduces sodium uptake in rice (Oryza sativa L.) seedlings by reducing bypass flow, Plant Cell Environment, 29: 1970-79
https://doi.org/10.1111/j.1365-3040.2006.01572.x
Grant J.J., and Loake J.G., 2000, Role of reactive oxygen intermediate and cognate green gram, Plant Science, 169: 331-339
Haq Y.J., and Schmidhalter U., 2002, Effect of salinity on tissue architecture in expanding wheat leaves, Planta, 220: 838-848
Hasegawa P.M., Bressan R., Zhu J.K., and Bohnert H., 2000, Plant cellular and molecular responses to high salinity, Annual Review of Plant Physiology and Plant Molecular Biology, 51: 463-499
https://doi.org/10.1146/annurev.arplant.51.1.463
Hodges M., 2003, Oxidative stress and post harvest produce, In: Hodges M. (ed.), Post Harvest Oxidative Stress in Horticultural Crops, Food Products Press, New York, pp.1-12
Ismail A.M., 2003, Effect of salinity on the physiological responses of selected lines/variety of rice, Journal of Plant Physiology, 162: 291–299
James R.A., Rivelli A.R., and Munns R., 2002, Factors affecting high apoplastic solute concentrations in leaves alter water relations of the halophytic shrub, Sarcobatus vermiculatus, Journal of Experimental Botany, 57: 139-147
https://doi.org/10.1093/jxb/erj016
Joseph B., Jini D., and Sujatha S., 2010, Biological and physiological perspectives of specificity in abiotic salt stress response from various rice plants, Asian Journal of Agric, Science, 2: 99–105
Khan M.H., and Panda S.K., 2008, Alterations in root lipid peroxidation and antioxidative responses in two rice cultivars under NaCl salinity stress, Acta Physiology of Plant, 30: 81-89.
https://doi.org/10.1007/s11738-007-0093-7
Khan M.H., Ungar I.A., and Showalter A.M., 2005, Salt stimulation and tolerance in an intertidal stem-succulent halophyte, Journal of Plant Nutrition, 28: 1365-1374
Kumer M., and Rashid M. A., 2009, Effect of salinity on growth of some modern rice cultivar, Journal of Agronomy, 3: 1-10
Meloni D.A., Oliva A.A., Martinez Z.A., and Cambraia J., 2003, Photosynthesis and activity of superoxid dismutase, peroxidase and glutathione reductase in cotton under salt stress, Journal of Environmental Sciences, 49: 69-76
Misra N., and Gupta A.K., 2005, Effect of salt stress metabolism in two high yielding genotypes of green gram, Plant Science, 169: 331-339
https://doi.org/10.1016/j.plantsci.2005.02.013
Mori Z., Chen J., and Mendham N.J., 2006, Physiological and cytological response of salt-tolerant and non-tolerant barley to salinity during germination and early growth, Australian Journal of Experimental Agriculture, 46: 555-562
https://doi.org/10.1071/EA05026
Pal A.J., Mansour M.M. and Salama F.Z., 2004, Water relations and xylem transport of nutrients, Climate Change, 66: 89-107
Parida A.K., and Das A.B., 2005, Salt tolerance and salinity effects on plants, Pakistian Journal of Botany, 40: 1657-1663
https://doi.org/10.1016/j.ecoenv.2004.06.010
Ramohya J., Lopez M.J., and Benlloch M., 2004, Effect of NaCl and KCl salts on the growth and yield of rice, Regulators, 41: 237-245
Sotiroupolous, 2007, Leaf growth and K+/Na+ ratio as an indication of the salt tolerance of three sorghum cultivars grown under salinity stress, Acta Agron Hungarica, 52: 291-297
Sposito, 1989, Studies on germination, seedling vigour, lipid peroxidation and proline metabolism in Catharanthus roseus seedlings under salt stress, South African Journal of Botany, 73: 190-195
Stepien P., and Klobus G., 2006, Water relations and photosynthesis in Cucumis sativus L. leaves under salt stress, Biologia Plantarum, 50: 610-616
Zhang N.A., Shah M., and Abraham G., 2006, Differential response of antioxidant enzymes to salinity stress in two varieties of Azolla (Azolla pinnata and Azolla filiculoides), Journal of Environment, 58: 216-222


. PDF(727KB)
. FPDF(win)
. HTML
. Online fPDF
Associated material
. Readers' comments
Other articles by authors
. A.F. Ologundudu
. A.T. Ajayi
Related articles
. Screenhouse
. Salinization
. Sampling
. Threshold
. Treatment
Tools
. Email to a friend
. Post a comment